70% of drivers don’t know what to do when they see this sign

We’re sure that most of our readers have heard the legend of Hackney Carriages having to carry a bale of hay and some oats for their horse (and contrary to popular belief, it was dropped from law in 1976), but traffic laws and road legislation in the UK are some of the most comprehensive in Europe, so it’s no surprise that many drivers can’t quite recall every one of our numerous road signs.

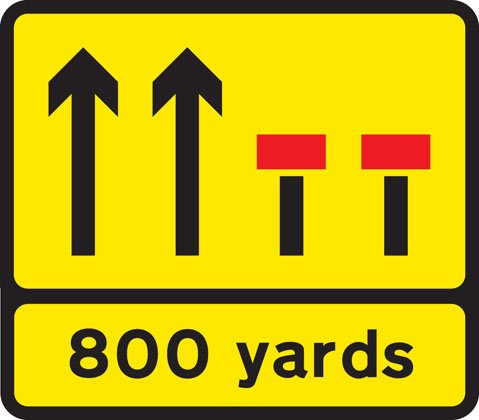
A survey of 22,000 motorists by Halfords Autocentres has revealed that 70% of drivers can’t correctly identify the meaning of this sign (right, used for illustrative purposes and may not reflect actual real-life signs).

Zip merging

The sign is used on motorways and dual carriageways, it shows that one lane ahead is blocked by an obstruction, but the confusion comes from understanding the next action. Pulling over into the next lane as soon as it’s possible is the majority choice, but one that is technically wrong.

What the sign is actually telling you to do is to continue driving in the lane until you’ve almost reached the merge point, then slowly ‘zip merge’ into the clear lane, where it’s safe and clear to do so. Just 27% of drivers knew the correct meaning in the survey, the last three percent believed that ‘straddling both lanes, blocking vehicles from reaching the head of the queue’ was acceptable.

Another survey by a national tyre chain also found that one in five road signs are a mystery to the average driver.

Avoidable breakdowns

The survey by Halfords was carried out as part of a roadworthiness campaign, but the fact that there are typically 85,000 breakdowns each year, with an estimated 40% being preventable isn’t what’s at interest here, this is more about driver education and habits.

36% of motorists admit to never reading the Highway Code once they’ve passed their driving test, and 20% of drivers haven’t read it within the last decade, is it a wonder that identifying signs isn’t at the forefront of their thoughts?

It seems easy to understand a great many of road signs, the ones we see daily are perhaps even ignored, only ever taking notice of ones that are clearly warning of danger, but while we may have a basic understanding of what they mean, could we 100% positively identify the sign and the textbook meaning? It’s doubtful.

Some years ago, AutoExpress polled 1,000 readers, 90% thought that driving standards were falling, but only 15% of respondents felt their driving standard had dropped, perhaps a brush-up on the Highway Code could help to change that thinking?

<!-- /283405443/PTP_Video_640x442 --><!-- [et_pb_line_break_holder] --><div id='div-gpt-ad-1549281272220-0' style='height:442px; width:650px;'><!-- [et_pb_line_break_holder] --><script><!-- [et_pb_line_break_holder] -->googletag.cmd.push(function() { googletag.display('div-gpt-ad-1549281272220-0'); });<!-- [et_pb_line_break_holder] --></script><!-- [et_pb_line_break_holder] --></div><!-- [et_pb_line_break_holder] -->

Highway code

While it’s easy to think that the Highway Code hasn’t changed significantly, you may be surprised to hear that in the last three years alone, there have been 48 updates to it, including changes to the MOT regulations, learner driver laws and penalties for using a handheld device.

With some organisations calling for more regular eye tests as part of an ongoing campaign to increase road safety, perhaps part of the test should include a brush-up on the Highway Code, or at least the changing road signs to help with awareness of what they all mean and how to respond correctly.

While it could be argued that the sign in question and the lack of knowledge regarding it is purely a case of semantics, the fact is that swapping lanes prematurely could actually increase congestion in the build-up to the blockage, and that’s before we get to the highly inconsiderate act of blocking the road so other drivers can’t ‘queue jump’.

It’s frustrating to see other motorists policing the roads themselves, the Police always advise against such actions, and yet drivers continue to act in such a manner. Maybe it’s those drivers that should be labelled as un-thinking or selfish, rather than the drivers happily going about their business, in full compliance of the law?

Bedtime reading

If you’re one of the 36% of drivers that haven’t read the Highway Code since passing your test, or even if you haven’t picked up a copy in the last five years, it could be worthwhile to familiarise yourself with the latest regulations and driving standards.

It’s unlikely that anyone will learn the full meaning and action of all 100+ road signs, but it’s a useful exercise in updating your own knowledge-base, and who knows, you may learn something new.
Should you wish to take part in the Halfords survey, you can find that here; please note that PetrolPrices has not been paid to endorse this survey, and has no affiliation with the survey or the creators and promoters. We put such links in at the interest of our readers.

Do you think that driving standards are falling? Should the average motorist know the meaning and action of all road signs? Will you share your result from the test? Let us know in the comments.

London scrappage scheme: PR stunt or helping hand?

In just seven weeks, a new daily charge is to be introduced for entering the City of London, it will affect all pre-Euro 4 petrol vehicles and pre-Euro 6 diesels, with no resident discount nor blue badge exemption, it’s thought that up to 2.5 million vehicles could be affected.

Unlike the congestion charge, this new tax will be levied 24-hours a day, 365 days a year, but to offset the tax, there will be a London-only vehicle scrappage scheme implemented for families on ‘low incomes’. According to Sadiq Khan, Mayor of London, the air quality in London is “a national disgrace”.

£25 million

Around 28% of people living in London are in poverty, and with London’s public transport costs being some of the most expensive in the world, many rely on their car for commuting, shopping and emergencies, more so than in other parts of the country.

But with the roll-out of the new Ultra Low Emission Zone, it’s thought that around 25,000 people per day could be expected to pay a further £4,550 per year to enter the city, and in October 2021, the scheme will spread to cover everything in-between the North and South Circular Road.

To avoid pushing families in to further poverty, a new car scrappage scheme will be introduced for those on low incomes, although no details have yet been published, aside from the headline grabbing ‘£25 million scheme’.

£10 per vehicle

The headline figure doesn’t seem that impressive when you realise that it equates to just £10 per vehicle in real terms, but the devil is in the (unpublished) detail.

As a bare minimum, a vehicle will need to be manufactured from around 2006 onwards for unleaded (forget diesel – 2015/16 or newer), and when demand squeezes the supply network, prices will inevitably rise.

It’s unlikely that the scrappage scheme will be paying cold hard cash to allow for a private purchase, which pushes the consumer to buy through a business, with an already fair mark-up on the vehicle but there will be an increase in paperwork for the dealer, which of course increases their overhead – so prices will rise further, or the quality of the product will reduce, meaning that a buyer will be getting a lesser deal either way.

Even working to a payment of just £500 per vehicle, that would only allow 50,000 vehicles to be swapped, to put that into perspective, that’s just 2% of the affected vehicles. The next question would be what kind of vehicle can you buy from a car dealer for £500?

<!-- /283405443/PTP_Video_640x442 --><!-- [et_pb_line_break_holder] --><div id='div-gpt-ad-1549281272220-0' style='height:442px; width:650px;'><!-- [et_pb_line_break_holder] --><script><!-- [et_pb_line_break_holder] -->googletag.cmd.push(function() { googletag.display('div-gpt-ad-1549281272220-0'); });<!-- [et_pb_line_break_holder] --></script><!-- [et_pb_line_break_holder] --></div><!-- [et_pb_line_break_holder] -->

25,000 per day

It’s thought that 25,000 vehicles each day would be liable for the extra tax, which over a five day week would equate to £1,562,500, or just over £80 million per year, that’s before congestion charging is taken into account.

Official sources will tell you that the congestion charge is a success; private car usage has fallen by around 39% since the introduction of it, but that doesn’t tell the complete picture – private hire vehicles, taxis and Uber use has increased by around 29%, it’s the increase in these vehicles that has led to journey times on public transport being extended, which of course has led to a decline in the number of people using public transport as it’s seen as too unreliable. Despite the volume of traffic being less, the average journey time has still increased, the speed of traffic has reduced further.

In 2017, TfL registered the first drop in revenue for the congestion charging zone, they also lost the £700 million / year operational grant from the government, and Sadiq Khan promised to freeze public transport fares, at a cost of £640 million, despite passenger numbers and fare revenue being down by £240 million.

Could there be an extra motive behind the Ultra Low Emission Zone charging? And the extension of that?

Clean air

Nobody is denying that air quality is an issue, and measures should be put in to place to tackle it, but hitting the poorest families that are reliant on their vehicle to just survive shouldn’t be part of the equation.

With plans in place to charge employees parking at work, congestion charging, and ULEZ charges, owning a car has never been more expensive, and despite the Mayor of London trying to sugar coat it, the pill is very bitter to swallow.

Town centres are dying, a further 16 city representatives were at the Clean Air Summit where Khan announced his plans, they were all in agreement that the motorist should bear the brunt of the cost to clean up the pollution, but what happens when dirty vehicles are replaced with clean? Who will pay then?

What do you think of the vehicle scrappage scheme? Is it a genuine effort to help the poorest, or merely sugar-coating the pill? Let us know in the comments.

It’s quicker to cycle than drive in UK cities, says report

As UK roads get more and more congested, it seems that some drivers will have to become what they have, on the whole, despised for years. A cyclist. INRIX is saying it could now be quicker to cycle than to drive if you commute into a city centre.

In many major UK cities, cars are travelling slower than the average cyclist does on the last mile of their journey. A new report by INRIX, a big data company specialising in roads, found that it was quicker to cycle than to drive, based on last mile speed in 6 major UK cities.

UK wide picture

On average, drivers in the UK lost 178 hours yearly due to congestion, costing the UK £7.9 billion over the year. For an average UK driver, this is £1317, an impressive amount when you look at it.

Six cities across the UK had an average last mile speed of 10mph or less, and when the average cyclist does 9.6mph, it seems almost ridiculous to carry on driving. While for some they may not be able to drive, for those who have adequate facilities at workplaces or live close enough to walk/cycle, it seems a much better option. In six UK cities, you’d actually travel faster by bicycle than a car.

In Central London, Sadiq Khan, Mayor of London, wants 80% of journeys into the city centre to be by public transport, walking or cycling by 2041. At the moment, people are avoiding public transport finding it to be unreliable slow, or not getting them there when they need it to be.

As the table below shows, unsurprisingly London has the highest cost of congestion per driver, and the highest time lost due to congestion. Birmingham came in second in the UK but placed 51st in the overall worldwide ranking, much better than London’s 6th place.

Leeds congestion increased by 6% over the year, and one traffic campaigner from Leeds cited the evergrowing number of single drivers entering and crossing the city centre. Rob Greenland, co-director of Social Business Brokers, said to the Yorkshire Post “The cause of the near-daily congestion isn’t … a car broken down on the inner ring road, or whatever today’s excuse is. It’s the fact that there are too many people travelling alone in cars, so that when there’s a problem (traffic light failure, collision, broken down car) the system collapses. There is no resilience – because too many of us are travelling in a way that the system just can’t cope with.”

<table><!-- [et_pb_line_break_holder] --> <tr><!-- [et_pb_line_break_holder] --> <th>URBAN AREA</th><!-- [et_pb_line_break_holder] --> <th>2018 WORLDWIDE IMPACT RANKING (2017)</th><!-- [et_pb_line_break_holder] --> <th>HOURS LOST IN CONGESTION</th><!-- [et_pb_line_break_holder] --> <th>COST OF CONGESTION (PER DRIVER)</th><!-- [et_pb_line_break_holder] --> <th>INNER CITY LAST MILE SPEED (MPH)</th><!-- [et_pb_line_break_holder] --> </tr><!-- [et_pb_line_break_holder] --> <tr><!-- [et_pb_line_break_holder] --> <td>London</td><!-- [et_pb_line_break_holder] --> <td>6 (6)</td><!-- [et_pb_line_break_holder] --> <td>227 (6)</td><!-- [et_pb_line_break_holder] --> <td>£1,680</td><!-- [et_pb_line_break_holder] --> <td>7</td><!-- [et_pb_line_break_holder] --> </tr><!-- [et_pb_line_break_holder] --> <tr><!-- [et_pb_line_break_holder] --> <td>Birmingham</td><!-- [et_pb_line_break_holder] --> <td>51 (52)</td><!-- [et_pb_line_break_holder] --> <td>134 (68)</td><!-- [et_pb_line_break_holder] --> <td>£994</td><!-- [et_pb_line_break_holder] --> <td>12</td><!-- [et_pb_line_break_holder] --> </tr><!-- [et_pb_line_break_holder] --> <tr><!-- [et_pb_line_break_holder] --> <td>Glasgow</td><!-- [et_pb_line_break_holder] --> <td>54 (57)</td><!-- [et_pb_line_break_holder] --> <td>99 (117)</td><!-- [et_pb_line_break_holder] --> <td>£736</td><!-- [et_pb_line_break_holder] --> <td>11</td><!-- [et_pb_line_break_holder] --> </tr><!-- [et_pb_line_break_holder] --> <tr><!-- [et_pb_line_break_holder] --> <td>Manchester</td><!-- [et_pb_line_break_holder] --> <td>85 (92)</td><!-- [et_pb_line_break_holder] --> <td>156 (34)</td><!-- [et_pb_line_break_holder] --> <td>£1,157</td><!-- [et_pb_line_break_holder] --> <td>10</td><!-- [et_pb_line_break_holder] --> </tr><!-- [et_pb_line_break_holder] --> <tr><!-- [et_pb_line_break_holder] --> <td>Bristol</td><!-- [et_pb_line_break_holder] --> <td>86 (90)</td><!-- [et_pb_line_break_holder] --> <td>149 (45)</td><!-- [et_pb_line_break_holder] --> <td>£1,099</td><!-- [et_pb_line_break_holder] --> <td>8</td><!-- [et_pb_line_break_holder] --> </tr><!-- [et_pb_line_break_holder] --> <tr><!-- [et_pb_line_break_holder] --> <td>Edinburgh</td><!-- [et_pb_line_break_holder] --> <td>87 (79)</td><!-- [et_pb_line_break_holder] --> <td>165 (24)</td><!-- [et_pb_line_break_holder] --> <td>£1,219</td><!-- [et_pb_line_break_holder] --> <td>8</td><!-- [et_pb_line_break_holder] --> </tr><!-- [et_pb_line_break_holder] --> <tr><!-- [et_pb_line_break_holder] --> <td>Sheffield</td><!-- [et_pb_line_break_holder] --> <td>90 (93)</td><!-- [et_pb_line_break_holder] --> <td>149 (44)</td><!-- [et_pb_line_break_holder] --> <td>£1,101</td><!-- [et_pb_line_break_holder] --> <td>10</td><!-- [et_pb_line_break_holder] --> </tr><!-- [et_pb_line_break_holder] --> <tr><!-- [et_pb_line_break_holder] --> <td>Leicester</td><!-- [et_pb_line_break_holder] --> <td>98 (98)</td><!-- [et_pb_line_break_holder] --> <td>155 (37)</td><!-- [et_pb_line_break_holder] --> <td>£1,145</td><!-- [et_pb_line_break_holder] --> <td>11</td><!-- [et_pb_line_break_holder] --> </tr><!-- [et_pb_line_break_holder] --> <tr><!-- [et_pb_line_break_holder] --> <td>Leeds</td><!-- [et_pb_line_break_holder] --> <td>101 (106)</td><!-- [et_pb_line_break_holder] --> <td>143 (52)</td><!-- [et_pb_line_break_holder] --> <td>£1,057</td><!-- [et_pb_line_break_holder] --> <td>13</td><!-- [et_pb_line_break_holder] --> </tr><!-- [et_pb_line_break_holder] --> <tr><!-- [et_pb_line_break_holder] --> <td>Liverpool</td><!-- [et_pb_line_break_holder] --> <td>104 (91)</td><!-- [et_pb_line_break_holder] --> <td>119 (85)</td><!-- [et_pb_line_break_holder] --> <td>£878</td><!-- [et_pb_line_break_holder] --> <td>10</td><!-- [et_pb_line_break_holder] --> </tr><!-- [et_pb_line_break_holder] --> <tr><!-- [et_pb_line_break_holder] --> <td>Belfast</td><!-- [et_pb_line_break_holder] --> <td>121 (112)</td><!-- [et_pb_line_break_holder] --> <td>190 (16)</td><!-- [et_pb_line_break_holder] --> <td>£1,406</td><!-- [et_pb_line_break_holder] --> <td>8</td><!-- [et_pb_line_break_holder] --> </tr><!-- [et_pb_line_break_holder] --> <tr><!-- [et_pb_line_break_holder] --> <td>Cardiff</td><!-- [et_pb_line_break_holder] --> <td>131 (123)</td><!-- [et_pb_line_break_holder] --> <td>143 (53)</td><!-- [et_pb_line_break_holder] --> <td>£1,056</td><!-- [et_pb_line_break_holder] --> <td>9</td><!-- [et_pb_line_break_holder] --> </tr><!-- [et_pb_line_break_holder] --> <tr><!-- [et_pb_line_break_holder] --> <td>Nottingham</td><!-- [et_pb_line_break_holder] --> <td>140 (136)</td><!-- [et_pb_line_break_holder] --> <td>149 (43)</td><!-- [et_pb_line_break_holder] --> <td>£1,101</td><!-- [et_pb_line_break_holder] --> <td>10</td><!-- [et_pb_line_break_holder] --> </tr><!-- [et_pb_line_break_holder] --> <tr><!-- [et_pb_line_break_holder] --> <td>Hull</td><!-- [et_pb_line_break_holder] --> <td>142 (138)</td><!-- [et_pb_line_break_holder] --> <td>151 (41)</td><!-- [et_pb_line_break_holder] --> <td>£1,118</td><!-- [et_pb_line_break_holder] --> <td>12</td><!-- [et_pb_line_break_holder] --> </tr><!-- [et_pb_line_break_holder] --> <tr><!-- [et_pb_line_break_holder] --> <td>Newcastle</td><!-- [et_pb_line_break_holder] --> <td>147 (143)</td><!-- [et_pb_line_break_holder] --> <td>90 (135)</td><!-- [et_pb_line_break_holder] --> <td>£666</td><!-- [et_pb_line_break_holder] --> <td>19</td><!-- [et_pb_line_break_holder] --> </tr><!-- [et_pb_line_break_holder] --> <tr><!-- [et_pb_line_break_holder] --> <td>Coventry</td><!-- [et_pb_line_break_holder] --> <td>167 (177)</td><!-- [et_pb_line_break_holder] --> <td>90 (134)</td><!-- [et_pb_line_break_holder] --> <td>£666</td><!-- [et_pb_line_break_holder] --> <td>17</td><!-- [et_pb_line_break_holder] --> </tr><!-- [et_pb_line_break_holder] --> <tr><!-- [et_pb_line_break_holder] --> <td>Stoke-on-Trent</td><!-- [et_pb_line_break_holder] --> <td>168 (165)</td><!-- [et_pb_line_break_holder] --> <td>107 (102)</td><!-- [et_pb_line_break_holder] --> <td>£794</td><!-- [et_pb_line_break_holder] --> <td>14</td><!-- [et_pb_line_break_holder] --> </tr><!-- [et_pb_line_break_holder] --> <tr><!-- [et_pb_line_break_holder] --> <td>Southampton</td><!-- [et_pb_line_break_holder] --> <td>173 (176)</td><!-- [et_pb_line_break_holder] --> <td>111 (96)</td><!-- [et_pb_line_break_holder] --> <td>£821</td><!-- [et_pb_line_break_holder] --> <td>11</td><!-- [et_pb_line_break_holder] --> </tr><!-- [et_pb_line_break_holder] --> <tr><!-- [et_pb_line_break_holder] --> <td>Swansea</td><!-- [et_pb_line_break_holder] --> <td>191 (191)</td><!-- [et_pb_line_break_holder] --> <td>95 (126)</td><!-- [et_pb_line_break_holder] --> <td>£704</td><!-- [et_pb_line_break_holder] --> <td>10</td><!-- [et_pb_line_break_holder] --> </tr><!-- [et_pb_line_break_holder] --></table><!-- [et_pb_line_break_holder] --> <em> Data taken from <a href="http://inrix.com/scorecard/">INRIX Global Traffic Scorecard</a>. Used for editorial purposes only.</em><!-- [et_pb_line_break_holder] -->
<!-- /283405443/PTP_Video_640x442 --><!-- [et_pb_line_break_holder] --><div id='div-gpt-ad-1549281272220-0' style='height:442px; width:650px;'><!-- [et_pb_line_break_holder] --><script><!-- [et_pb_line_break_holder] -->googletag.cmd.push(function() { googletag.display('div-gpt-ad-1549281272220-0'); });<!-- [et_pb_line_break_holder] --></script><!-- [et_pb_line_break_holder] --></div><!-- [et_pb_line_break_holder] -->

UK vs the World

While London placed 6th overall, the rest of the UK fared better, with Birmingham coming in a respectable 51st and Glasgow in 54th.

For comparison, Dublin did not do well at all, as the city actually had the slowest last mile travel speed of any city worldwide, which is “The time it takes to travel one mile into the central business district during peak hours.” On average, you would drive at 6mph in the centre of Dublin during peak times, which is the worst of any city and urban area in the UK!

Last month, we told you about NICE wanting to give cyclists and pedestrians priority on roads, and so it seems that over the next twenty years, cities across the world will be designed with cyclists and other forms of transport over cars, as they help to reduce congestion in major cities, and you’ll go faster in a fair few of them.

Commenting on the report , Glynn Barton, Director of Network Management at TfL, said: “We are taking bold action to reduce congestion and improve London’s poor air quality. This includes removing the Congestion Charge exemption for private hire vehicles and reducing the time taken to clear up unplanned incidents, ensuring that roadworks by utilities companies and others are better coordinated. We are also working with the freight industry to encourage more efficient deliveries across the capital.”

“To directly tackle poor air quality, we are ensuring that buses, taxis and private hire vehicles are as green as possible, alongside the introduction of the Ultra-Low Emission Zone this April. In delivering the Mayor’s ambitious plans for 80 per cent of all journeys to be made by public transport, walking or cycling by 2041, our plans will further help tackle congestion across London.”

Worst UK roads to drive on

In rush hour the worst UK road was the A406 from the Chiswick Roundabout to Hanger Lane, with a daily delay of 15 minutes. The A406 also pops up further down the list in spot 6, with the congestion from the A1 to the A10 having a daily delay of 11 minutes. At peak travel time in London, the average mph was just 15.58 mph, and a reasonably fit cyclist can do up to 25mph on their commute, so it might be quicker to cycle for you if you live in a city centre.

Fifteen minutes daily may not seem like much, but over a year it equals to 61 hours for someone doing a daily journey, just over two and a half days.

In Leeds the Leeds Road/Saltaire Road was the worst, with the section between the Harrogate Road and the Bradford Road having a daily delay of 11 minutes, equaling 44 hours over the year.

Would you consider cycling to work if you knew it would save you time and money? Do you think cities should be doing more to reduce congestion? Let us know below

The smaller the car, the more reliable it is says Which?

Choosing the right car for you can be a mixture of sensible decision, financial obligation and with a hint of raw emotion, but even the prettiest of cars will be given the cold shoulder in the cold hard light of reliability statistics.

A new survey by Which? has concluded that the Luxury and SUV class of cars are more unreliable than small city cars, by some margin.

The short version is that when dealing with cars up to three-years-old, the more money you spend, the more likely it is that you’ll have reliability problems.

Reliability statistics

Which? have surveyed the owners of approximately 51,000 vehicles, they found that luxury vehicles like the BMW 5 & 7 Series or the Mercedes-Benz E and S-Class spent, on average, 2.58 days off the road last year and that the reliability affected 32% of the vehicles.

Compare that to a small city car, like the Toyota Aygo, and the figure drops to just 17% of vehicles, with a shorter time off the road – 1.26 days typically.

The next most common class for faults was the sports-utility vehicle – 27% suffered faults with an average of 2 days in the garage.

Surveys

On the face of it, the study by Which? does seem to hold some valid information, but the missing link in the survey is manufacturer – many of the larger brands can offer you a range of vehicles, from small city car through to SUV, so could it be a manufacturing problem rather than a specific vehicle category?

A study by Auto Express revealed that the top three ‘Most Reliable Manufacturers’ are Lexus, Jaguar and Mercedes-Benz – all luxury and SUV, compare that to their findings for the least reliable – Dacia, Vauxhall and Chevrolet – brands not exactly known for their luxury or SUV offerings.

Of course, there are exceptions – Mercedes make the A-Class for example, and Chevrolet make a number of SUVs, albeit rebadged Opel’s, which we’d know better as Vauxhall, so that would fit with the Auto Express poll – both Vauxhall and Chevy occupying the bottom two spots.

<!-- /283405443/PTP_Video_640x442 --><!-- [et_pb_line_break_holder] --><div id='div-gpt-ad-1549281272220-0' style='height:442px; width:650px;'><!-- [et_pb_line_break_holder] --><script><!-- [et_pb_line_break_holder] -->googletag.cmd.push(function() { googletag.display('div-gpt-ad-1549281272220-0'); });<!-- [et_pb_line_break_holder] --></script><!-- [et_pb_line_break_holder] --></div><!-- [et_pb_line_break_holder] -->

Car reliability

With regulations on nearly every aspect of a car getting tighter – crash survivability, functionality, emissions, economy and performance, coupled with the need to incorporate more technology for in-car entertainment, safety or ‘luxury’, the amount of electronic equipment fitted has increased dramatically over the last decade, perhaps more so over the last 5-years.

Also, it’s ‘technology’ that seems to lead the way for the reliability problems – onboard software, in-car entertainment, built-in satnav, electrically controlled components (windows, sunroof & mirrors) and exhaust or emission control top the list for faults – very few mechanical faults. Does it fit that the more tech fitted, the more problems? Perhaps it’s this that the Which? study relates to.

Buying advice

The simple truth is that reliability has increased exponentially over the last two or three decades, and we’ve gone from adjusting the ‘points’, setting the timing, mopping up oil and having regular ‘tune-ups’ to barely lifting the bonnet between services, and perhaps that’s only to top-up the screenwash.

Instances of mechanical failures are on the decline; robots build cars, components are checked automatically, anything outside of tolerance is re-purposed – there really isn’t such a thing as a ‘Friday afternoon car’ anymore, but we expect so much more, but part of that is because we know so much more.

The world of internet has opened up a new knowledge-base, as has the car’s ability to tell us something is wrong, but it’s entirely due to the technology fitted that the majority of reliability concerns arise, but that in itself is a benefit.

According to the Which? survey, the worst offending cars are off the road for an average of 2.58 days in a year, if they were treating mechanical breakdowns, you could easily double that, with an appropriate increase in labour to strip & rebuild, rather than reprogram.

Perhaps the better headline should be “Cars are so reliable today that even the worst offender only spends two-and-a-half days off the road”.

The term ‘reliability’ is relative, the defining key to it is quite fluid – a problem with the satnav, for example, doesn’t render the car unusable or unsafe, merely … not what we expect in this day and age, and surely that in itself speaks volumes?

Yes, it’s technology that’s causing the majority of these ‘reliability’ problems, but equally, it’s technology that has solved the wider issue of mechanical breakdowns – leaving us stuck by the side of the road waiting for a recovery vehicle.

If you are looking for a new car, and want something a bit smaller, then look no further than the Volkswagen Polo 1.0 TSI 95 SE which one the Small Car of the Year award at the WhatCar? awards this year. Our partner CarKeys can help to source this car for you, simply head here, and fill in your details and they’ll be in contact.

What do you think of the Which? survey? Have they got it right, or is it misleading the buying public? Let us know in the comments.

Electric cars can have 40% less range in freezing temperatures

The writing has been on the wall for a while now: Electric cars are here to stay, the death knell is ringing for fossil fuel.

That’s all very black & white though, and the reality is perhaps a little different. Certainly, electricity is the motive force of the future, and for the moment, developments are happening so fast that even oil giants like BP are investing heavily in the infrastructure. But can BEVs really cope with everything that internal combustion can?

At the moment, not really.

That isn’t to say that they aren’t a viable alternative right now, just that any owner of a Battery Electric Vehicle needs to get used to that twinge in the pit of their stomach called ‘Range Anxiety’.

Range anxiety

Read any write-up, report or owner’s perspective about their BEV and they all mention the same thing – fantastic in every way aside from the range anxiety, which they’ve all suffered from at some point.
Typically, ‘optimum’ ranges can be anywhere between 130 miles – 290 miles depending on the vehicle, but just as manufacturers use their know-how to ‘increase’ the mpg figures for a regular car, so do electric vehicle manufacturers.

One example of this is temperature. Although each manufacturer does carry out extreme weather testing, the published figures are, of course, taken from optimum conditions – battery cells like to be comfortable, around 21 degrees Celsius, start deviating from that temperature, and things start looking different.

The American Automobile Association have recently compared the effect that temperature can have on the optimum range, and staggeringly, it could be as much as 41% to the deficit in cold weather. That doesn’t mean the reverse is true either; warm things up above the optimum, and you’ll still see a decrease in battery reserve, although not as acute.

For the record, we aren’t talking extremes of weather unlikely to be found in the UK – approximately 6 degrees below zero, or 35 degrees above.

Extreme weather effects

The decrease in range is down to a number of elements, partly physics, partly comfort.

Timothy Grewe, chief engineer at the General Motors Electric Propulsion Laboratory explains: “When the weather gets cold, the battery components develop increased resistance that limits how much power they can hold, as well as how fast a battery pack can be charged or discharged”.

That loss of efficiency equates to around 12% without the heater running, but staying warm could add a further 28% loss in range; testers noticed an overall loss of 41% on some models, including the heating system for the battery (which is separate from the cabin heater).

While extreme warmth also loses range, it’s nothing like as much – around 4% without the air-conditioning running, and 17% with.

While few manufacturers have officially commented on AAA’s findings, a spokesperson for Tesla commented: “Based on the real-world data from our own fleet, which includes millions of long trips taken by real Model S customers, we know with certainty that even when using heating and air-conditioning, the average Model S customer doesn’t experience anywhere near that decrease in range at -6 degrees, and the decrease in range at 35 degrees is roughly 1%”.

<!-- /283405443/PTP_Video_640x442 --><!-- [et_pb_line_break_holder] --><div id='div-gpt-ad-1549281272220-0' style='height:442px; width:650px;'><!-- [et_pb_line_break_holder] --><script><!-- [et_pb_line_break_holder] -->googletag.cmd.push(function() { googletag.display('div-gpt-ad-1549281272220-0'); });<!-- [et_pb_line_break_holder] --></script><!-- [et_pb_line_break_holder] --></div><!-- [et_pb_line_break_holder] -->

Battery improvements

While we’re used to seeing improvements in the technology, batteries and range, these losses may be difficult to engineer out. An internal combustion engined car has lots of spare heat energy, so diverting some of that to the cabin is relatively straightforward, but an electric car only has the capacity to generate heat by using the onboard electricity.

It’s a similar story for the battery heating system.

It would seem as though the best advice if you have an electric vehicle is to try and pre-condition the car while it’s still plugged in – either heating it up or cooling it down, most of the BEVs allow for this, along with storing it in the garage or at least ‘out of the wind’ where possible.

Future-proof

There is no doubt that electric vehicles are taking big steps toward being a genuine, viable alternative to their internal combustion counterparts, but that’s at a price, both in terms of financial and practicality. There are still a number of issues that need ironing out before they truly beat fossil-fuel in a fair fight, but is that so surprising seeing that the car as we know it has been under development for well over a century?

No doubt that someone will point out that electric vehicles were also developed over 100-years ago, but they were never mainstream, or that both petrol & diesel also lose efficiency when temperatures plummet, but the difference here is that it’s an easy job to refuel, that takes 5 minutes.

Would you own an electric vehicle? Is it something that you want, but practicality or financial reasons outweigh the decision? Let us know in the comments.

Half a million drivers seen using mobile phone at wheel in 2017

Using a mobile phone at the wheel is never a good idea, and except in some extreme circumstances is also illegal. Between 2013 and 2015 an average of 24 people were annually killed in a car crash where a mobile phone was cited as the main cause.

While the number of people using a phone at the wheel has fallen since 2015, experts are worried that the statistic doesn’t reflect the actual number of those using phones.

Roadside survey

The phone observations were done through a roadside survey conducted over a period of time by the Department for Transport. The survey is done every two years, and there was a 0.5% decrease in mobile phone use noted from the 2015 survey to the 2017 survey.

Observations were made while cars were stationary and when they were moving, in order to properly understand the difference in behaviours.

Over 90 different sites were used in the survey, in different areas and spread far across the country. Some were rural, some suburban, and some were urban. Motorways were not included in the survey as it is impossible to get accurate results from such high-speed roads.

Unpacking the stats

The survey found out loads of statistics about user behaviour, but what does it actually show us about how people use mobile phones, and what tech companies should be doing to help stop the 24 people a year who die because of a driver using their phone.

Overall, 1.1% of drivers were observed using a mobile phone on a weekday. Interestingly, the difference between Scotland and England and Wales was over double, as drivers seen on their phone was 2%, compared to 0.6% in England and Wales.

Motorists between ages 17-29 were the worst offenders with 4% of drivers in that age category caught using a phone at the wheel. However, the gender split for all age groups was fairly minimal with 1.2% of men and 1.1% of women getting caught.

The introduction of the stricter law in March 2017 will have impacted the results, but the DFT clearly states that “this does not imply causation or prove the effectiveness of the policy.”

<!-- /283405443/PTP_Video_640x442 --><!-- [et_pb_line_break_holder] --><div id='div-gpt-ad-1549281272220-0' style='height:442px; width:650px;'><!-- [et_pb_line_break_holder] --><script><!-- [et_pb_line_break_holder] -->googletag.cmd.push(function() { googletag.display('div-gpt-ad-1549281272220-0'); });<!-- [et_pb_line_break_holder] --></script><!-- [et_pb_line_break_holder] --></div><!-- [et_pb_line_break_holder] -->

Real life impact

Using a phone behind the wheel is a choice, and those who do are not only putting themselves at risk, but also everyone around them. The sad death of Carol Boardman in 2016 after a motorbike hit her, was cited due to the rider being distracted by his mobile phone. Similarly, the case of David Shields up in Scotland shows the same. He was playing for his mobile phone for a total of 18 seconds before he crashed into the back of Yvonne Blackman’s car, of which she later died of severe injuries sustained from the crash.

Distracted driving is becoming a real issue, and now with cars implementing more and more tech, are we on the brink of an increase in distracted driving collisions?

Cars are also getting safer and safer, so are we taking our driving less seriously as we know our cars can protect us? Even 20 years ago, cars were a lot less safe, and people were aware and so drove more carefully. Now, our cars protect us more and more, they have special protective elements, from crumple zones to pre-collision sensors and automatic emergency braking.

What needs to change?

Experts are concerned that the reality of these stats isn’t true and that the actual figures are much higher.

Tech companies are working on ways to help stop users behind the wheel, and Apple has their “Do Not Disturb While Driving” mode for iOS 11 and up that automatically detects when you are driving and will switch it on. It replies to all texts with an automatic response and keeps the screen off and silent. If you have Bluetooth or a phone interface in the car, it will allow the phone to connect to that, but keeps it silent still.

Android, unless you have a Google Pixel 2 or up, doesn’t automatically have this feature, although the phone does know when you are driving through Google Maps. It is thought that they are rolling out this feature to more phones soon.

There’s a couple of apps you can get for Android that work quite well, depending on your preference. If you want a handsfree experience then you can use Android Auto, which while a bit clunky and slow works very well as a simple interface. It will allow you to automatically reply to texts and can auto-reply to calls with an “I’m driving right now” if you’d like it to. Auto also has your music, maps and calls in a large menu at the bottom of the screen.

If you’d prefer a complete Do Not Disturb experience, then there are plenty of apps out there that offer such a thing, while it’s not compatible with all Android devices, an app called Driving Detective mimics the Apple features for Android.

What do you think of the statistics? Should the law on mobile phones become stricter? Let us know below

Drink drive arrests plunge amongst shortage of breathalysers

Incidents of drink-driving are on the increase, around 7% up typically, and yet some areas are seeing a 26% decrease in arrests for the offence.

Budget cuts are affecting all aspects of policing; the West Midlands force has just 302 working breathalyser kits to share between 3,500 officers.

Road deaths have increased by an average of 20% since 2017.

Drink driving

In January 1966, the new Road Safety Bill was introduced, part of that bill concerned alcohol levels for drivers, although the breathalyser wasn’t introduced until a year later. In the intervening years, cases of drink-driving have reduced dramatically; 1979 saw 19,740 prosecutions, thirty-five years later and the numbers are less than half – 8,740 in 2015.

Despite those numbers, incidents of drink & drug driving are now on the increase – drink-driving offences are the highest they’ve been since 2012, and yet the number of tests carried has been significantly reduced – 563,427 in 2011, to just 325,887 in 2017.

But then with a 12.8% decrease in actual ‘feet on the beat’, is it any wonder that criminals are getting away with more?

John Apter, chairman of the National Police Federation states: “The number of motorists stopped for drink & drug driving, using a mobile phone or not wearing a seatbelt has dropped by 52% since 2011, but I don’t believe that the reduction is due to people no longer carrying out the offence, it’s simply that they aren’t being caught”.

“We are just being stretched so far that we no longer have the budget to target certain areas, like roads policing”.

Societal change

It has taken decades for drink-driving to become so stigmatised to the point of a change in society, from it being seen as ‘the norm’ through to being concerned about it due to the legal repercussions, to actually condemning those that still think they pose no risk while under the influence.

But a number of high-ranking officials are worried that drink-driving will become more acceptable again, due to the lower incidences of prosecution; Richard Cooke, chair of the West Midlands Federation believes that people could view it as a lesser crime, thanks to the de-prioritisation of prosecution. The reality is that the police (and society) still view it as completely unacceptable, it’s just that “colleagues are constantly reporting that they have difficulty getting hold of a working kit when they need it”.

<!-- /283405443/PTP_Video_640x442 --><!-- [et_pb_line_break_holder] --><div id='div-gpt-ad-1549281272220-0' style='height:442px; width:650px;'><!-- [et_pb_line_break_holder] --><script><!-- [et_pb_line_break_holder] -->googletag.cmd.push(function() { googletag.display('div-gpt-ad-1549281272220-0'); });<!-- [et_pb_line_break_holder] --></script><!-- [et_pb_line_break_holder] --></div><!-- [et_pb_line_break_holder] -->

Budget cuts

The BBC has calculated that since 2010, funding for the police has been cut by around 20% in real terms, despite promises from the government with regards to an extra £450m in ring-fenced funding. The problem partly stems from where that funding is found.

Half of the £450m will be made up from council tax, but this requires all the councils to increase their individual Council Tax rate to the maximum allowed, so the reality is that the ‘guaranteed’ funding isn’t … guaranteed.

Police resource, both in terms of workforce and equipment is at an all-time low. Depending on which statistics you believe, the number of officials has fallen from an all-time high of 177,600 in 2010 to just below 150,000 in 2018, some even put the figure as low as 122,000.
A recent survey found that around half of the population believe they haven’t seen a police officer in their area for more than a year.

Automated policing

It’s clear that budget cuts and restrictions are affecting the policing of our roads, perhaps it’s no wonder that automated technology like safety cameras are taking over the day-to-day infringements, but even with smart tech that can monitor distracted driving, it needs a trigger – someone actually speeding.

Drunk driving may not necessarily trigger a safety camera, and even if it does, today’s tech can’t tell that the driver is over the blood-alcohol limit, so it’s a feasible concern that some motorists will take their chances and risk lives while doing so.

There’s no simple answer, but it does lead us back to last weeks report on Huawei filing papers for technology that can detect a drink or drug driver in an autonomous car; perhaps their technology could be put to better use?

Of course, it could still be construed as a huge civil rights issue, but perhaps this is a case where the needs of the few, outweigh the needs of the many? Just how far should society go in order to eradicate drink-driving completely?

The budget cuts mean that forces are having to prioritise their workload, and police numbers are dwindling, it’s easy to envisage a day that only the most serious of crimes will be investigated by the police, perhaps with a secondary, privatised force investigating all other crimes.

Can society eradicate drink or drug driving? Would you accept a mandatory anti-drink-drive system in your car? Or should the government change priorities? Let us know in the comments.

Auto-renewing your car insurance could cost you an extra £130 every year

Every year people in the UK spend an astonishing £78billion on insurance premiums. The Financial Conduct Authority (FCA) report that more than four out of five people have at least one insurance policy—with home and car insurance the most common.

On Friday, the regulatory body, the FCA exposed how renewing car insurance with the same company could end up costing consumers £130, outraging campaigners and MPs. This leads us to ask; with the price of motoring ever increasing, can drivers still afford to be loyal?

The cost of loyalty

Insurance is a business famous for securing customers with offers that appear to be bargains, only to raise their premiums every year, resulting in drivers who don’t switch policies ending up paying far more than those who comparison shop.

Yet, if insurers charged all customers the same cheap prices offered to new customers, they wouldn’t make any profit. If they charged costlier, but higher rates to everyone, they’d lose customers to firms who continue to offer low introductory premiums. It’s a vicious pricing circle.

The FCA released figures showing how motorists who stay with the same insurance company for eight consecutive years may end up paying over £130 more than those customers who switch to a better deal every 12 months.

Their most recent figures also show that a driver who compares prices saves an average of £64 each year.

Years with an insurer and average yearly saving if you had switched

One year: £64.49
Two years: £65.47
Three years: £77.92
Four years: £77.91
Five years: £96.53
Six years: £88.93
Seven years: £63.54
Eight years: £130.83
Source: Financial Inclusion Commission/Financial Conduct Authority, via the MailOnline

Figures from the price comparison site GoCompare, show that switching to a different car insurance provider can save you a huge £268.69, yet despite knowing, by shopping around, they might make savings, a huge 65% of drivers renewed with their existing providers in 2018.

‘Shocking figures’

James Daley, Managing Director of the consumer group Fairer Finance, said:

“The more loyal a customer is, the more they get ripped off and the higher price they pay. This isn’t easy to solve.

“Price-comparison websites create fierce competition for new customers, and firms are looking to recover the money they lose on cheap introductory offers by getting it from customers who stay with them.”

Towards the end of last year, after a ‘super-complaint’ by Citizens Advice, the Competition and Markets Authority (CMA) found that loyal customers paid £4billion too much for certain financial services, with around 12million overpaying on their insurance.

Labour MP, Wes Streeting said:

“Good companies should recognise and reward loyalty from their customers.

“These shocking figures are a reminder of why shopping around is really important to get the best value for money.”

Car insurers have also received criticism for charging customers more to pay their premium monthly rather than in a lump sum each year—charging interest, like a loan. Experts believe large insurance firms earn up to £500million each year from this practice.

Time well spent

As customers, we still let insurance companies get away with overcharging us, because so many of us don’t realise it is happening, or switching provider seems too much effort. There are also people who don’t or can’t access the internet to aid them in their search.

To find a better deal:

Look at your latest policy paperwork (or email if you took out the policy online and you receive only paperless communication) to check what you’re paying. Even if your insurer was the cheapest last year, you shouldn’t assume the price they are offering is still competitive.

Check to see what your existing insurer would charge you if you were a new customer and, if you’re unhappy with the difference, contact your provider and tell them you’ll switch to another insurance firm unless you get a better deal.

If your current insurer won’t reduce your premium, begin your policy shopping using a price comparison tool. There are many comparison sites available and, depending on how much time you can devote and how much motivation you have, a good place to begin is with Confused.com — one of the leading comparison sites available.

Independent research carried out last year by Consumer Intelligence shows that shopping around could save 51% of car insurance customers £272.24.

Make sure you’re searching for a like-for-like policy and that you understand any charges, exclusions, penalties, and the terms and conditions. And always check the small print!

Once you’ve signed up for a new policy, set yourself a reminder for a week or two before the policy expires, allowing yourself time to shop around to get the best deal and not risk driving uninsured.

<!-- /283405443/PTP_Video_640x442 --><!-- [et_pb_line_break_holder] --><div id='div-gpt-ad-1549281272220-0' style='height:442px; width:650px;'><!-- [et_pb_line_break_holder] --><script><!-- [et_pb_line_break_holder] -->googletag.cmd.push(function() { googletag.display('div-gpt-ad-1549281272220-0'); });<!-- [et_pb_line_break_holder] --></script><!-- [et_pb_line_break_holder] --></div><!-- [et_pb_line_break_holder] -->

Do you think insurance companies should stop offering new customers bargain prices if loyal customers have to pay higher premiums? Do you comparison shop every year? Tell us your views in the comments.

Car industry on high alert as production slumps drastically

Car production was down 9.1% in 2018 due to numerous factors, including Brexit, lack of demand for diesel and strict emissions laws causing delays.

Jaguar Land Rover (JLR) was the hardest hit, with a 15% drop in production, with just under 450,000 cars leaving the factory, down from the 530,000 that left in 2017.

Brexit and the car industry

Brexit has been a cause of uncertainty for British car makers, with them closing plants, slowing down production, or in the case of JLR, suspending it completely for two weeks in their Solihull plant.

Back in July the CEO of JLR, Ralf Speth, said that a no-deal Brexit would be disastrous for car makers as they rely on a “free, frictionless, seamless logistics” system. One part missing from the production line could cost them as much as £60 million a day, he went on to warn, speaking of the implications that Brexit could have on their company.

“We, and our partners in the supply chain face an unpredictable future if the Brexit negotiations do not maintain free and frictionless trade with the EU and unrestricted access to the single market,” Mr Speth said.

“We urgently need greater certainty to continue to invest heavily in the UK and safeguard our suppliers, customers and 40,000 British-based employees.

A bad Brexit deal would cost Jaguar Land Rover more than £1.2bn profit each year. As a result, we would have to drastically adjust our spending profile. We have spent around £50bn in the UK in the past five years, with plans for a further £80bn in the next five.”

Demonisation of diesel

Thanks to the lack of incentive from the government to remove diesel cars, the backlash from consumers against diesel cars has risen drastically, with the market share for diesel shrinking to under a third last year compared with over 40% the previous year.

Industry experts have commented on the U-turn by Nissan to move production of its X-Trail from Sunderland to Japan as not as a marker on Brexit, but instead the heavy regulations on diesel that are being brought in. Michael Gove’s promise to wipe all petrol and diesel cars off the roads by 2040 has further discredited diesel cars.

Labour’s eagerness in the early 2000’s to incentivise diesel has unfortunately had a much larger backlash than anyone could’ve ever anticipated. With the revelation back in 2015 over VW’s dieselgate scandal the industry was thrown into a state of confusion and even now is still working on a plan to recoup losses. The promise of lessening the CO2, higher MPG, less time between fills and reduced exhaust emissions. After the discovery of the damage that NOx had on humans, and the dangerous particulates that were being emitted into the atmosphere, most governments went down the electric car route, promising efficiency and zero emissions. The small incentives they did offer were only accessible by those with more money, and the average Joe who had bought a diesel with the previous incentives couldn’t afford the new electric cars and their charging. Those who can afford an electric car are reaping the benefits, but with the government now reducing grants and lowering incentives, it’s up to the car manufacturers to make affordable, practical and long range EVs.

Toyota has shunned electric, preferring instead to use hydrogen, where they have got it to the point that they have to create mechanisms to slow down the cars as they are too fast for everyday driving. Hydrogen is also cleaner to produce, and the emissions can benefit the environment. The main issue with hydrogen is safe storage, as it is very reactive to the environment.

Some of the reasons for shunning electric in the UK include the strain on the National Grid, which is powered by fossil fuels, and therefore any significant increase in pressure will just burn more fossil fuels and almost negate the effect of introducing electric as the predominant fuel.

Strict emissions laws

In a bid to reduce excess pollution in crowded city centres, local councils have increased the enforcement of city centre driving to the point that it has affected jobs. Industry experts attribute some of the job cuts in JLR, Nissan et al to the strict and tight regulations.

In April, there will be a ULEZ (Ultra Low Emission Zone) in place in central London meaning that any car that doesn’t meet the standards will have to pay £12.50 a day to enter and drive within the limit.

On top of this, some cities are now introducing another charge for every parking space at an office that isn’t an EV space to discourage people from driving to work as the company will have to foot the bill.

It seems that we need to fully appreciate what the car industry provides to our country. It totals 4 percent of the nations total output, totalling £60.5 billion annually. If this trend continues, it will impact the whole country drastically.

<!-- /283405443/PTP_Video_640x442 --><!-- [et_pb_line_break_holder] --><div id='div-gpt-ad-1549281272220-0' style='height:442px; width:650px;'><!-- [et_pb_line_break_holder] --><script><!-- [et_pb_line_break_holder] -->googletag.cmd.push(function() { googletag.display('div-gpt-ad-1549281272220-0'); });<!-- [et_pb_line_break_holder] --></script><!-- [et_pb_line_break_holder] --></div><!-- [et_pb_line_break_holder] -->

What do you think of the production slump? How can the UK rescue the falling production? Let us know below

Autonomous cars report drunk drivers to police

<p style= font-size:11px>By <a href="//commons.wikimedia.org/wiki/User:Dllu" title="User:Dllu">Dllu</a> - <span class="int-own-work" lang="en">Own work</span>, <a href="https://creativecommons.org/licenses/by-sa/4.0" title="Creative Commons Attribution-Share Alike 4.0">CC BY-SA 4.0</a>, <a href="https://commons.wikimedia.org/w/index.php?curid=64517567">Link</a></p>

Chinese tech giant, Huawei, has recently filed a patent with the European Patent Office for what could amount to some of the most intrusive technology to be fitted to a vehicle.

It’s capable of detecting whether a driver is drunk, but also whether that driver is frustrated, drowsy or distracted. It can also recognise weapons, drugs and even a phone with text on the display.

Currently, the patent is for autonomous vehicles only, which in itself seems a moot point; the day that vehicles are truly 100% autonomous means there will be no driver ‘in charge’ of the vehicle, so why the technology?

The system will have the capability to decide for itself the best course of action, which ranges from warning the occupants, deactivating the controls or even calling the police.

Self-driving cars

Autonomy and self-driving are closely linked, but not necessarily the same thing, although for many motorists it’s the difference between branded or supermarket fuel – close enough that there’s no real distinction.

Self-driving cars are very much in their infancy – they still have the ability to wow us with their capability, to make headlines when one does something out of the ordinary, and yet they still need to have the human element, ‘just in case’.

Some industry experts are predicting that the first truly-autonomous vehicles will on the road as early as 2021, and the question remains – who will be in charge of them? The operator? Occupant? Owner? With the argument that any occupant will effectively be using a service akin to a taxi or ride-share, surely it doesn’t matter whether they’re distracted or drunk?

The defining point here is the definition of ‘Autonomous Vehicle’.

Sci-Fi

Science-fiction would have us believe that true autonomy comes without a steering wheel, almost a lounge-style cabin, and nothing to do but hold high-powered business meetings, or play with the onboard technology.

So will we still have the human element, and if so, does that necessitate a law against being in one drunk?

The National Transport Commission of Australia (NTC) believes that drink-driving laws need a shake-up.
In a discussion paper, the NTC states that “there is a clear-cut” justification for changing the laws regarding drink or drug-driving because there is no possibility that a human could drive a dedicated autonomous vehicle. “The situation is analogous to a person instructing a taxi driver where to go,” says the NTC.

<!-- /283405443/PTP_Video_640x442 --><!-- [et_pb_line_break_holder] --><div id='div-gpt-ad-1549281272220-0' style='height:442px; width:650px;'><!-- [et_pb_line_break_holder] --><script><!-- [et_pb_line_break_holder] -->googletag.cmd.push(function() { googletag.display('div-gpt-ad-1549281272220-0'); });<!-- [et_pb_line_break_holder] --></script><!-- [et_pb_line_break_holder] --></div><!-- [et_pb_line_break_holder] -->

Data privacy

It would seem as though Huawei, who manufacture no autonomous vehicles of their own, may have found a back-door entrance to scrutinise, store and potentially use personal data. Just as the Amazon Alexa listens constantly to every conversation you have, logs your preferences and buying habits, so too could Huawei.

Imagine a system that’s fitted to your car, that logs each journey, whether you have a penchant for a tipple, or even a cigarette, your mood when driving, the times you frequent the pub, supermarket or gym and then reports back to your insurance company (who for the sake of convenience, cover your life insurance as well).

Your insurance premium gets automatically adjusted, you have an accurate log of behaviour and movement, and anything remotely ‘questionable’ is all recorded, easily accessed by the police or insurance companies.

Perhaps this is what Motorola had in mind when they filed for a patent for a self-driving police car/courtroom, that placed the accused on trial via video link, with those found guilty being autonomously delivered to the nearest jail.

Road safety

Of course we’re in favour of road safety, and technology being used appropriately could make a big difference to accident rates and fatalities, but this kind of technology comes at the cost of privacy, some may even say infringing on our rights.

For those that disagree with this viewpoint, that believe a giant tech company would never abuse such exclusive and intimate detail of our lives, you’ve only got to look at the largest social-media platform (with over 1 billion users), and their understanding of privacy to see that this is a very real concern.

It’s understandable that the authorities are investing in technology to help make roads safer – the ‘yellow vultures’ may not be the answer, just the same as the majority of safety cameras, but with ever-increasing budget cuts, manpower is dwindling and technology is taking over. We just need the right type of technology.

Whether there is any validity to the patents (both Huawei and Motorola), the technology exists to make it happen, but we’re a short step away from an autonomous lifestyle, governed, measured and reported on.

What do you think to the ingress of technology in the automotive world? Do you see a need for such a system? Should we just sit back and let progress take its course? Let us know in the comments.