
Volvo limit top speed of all new cars to try and stop deaths

On Monday (4th March,) Volvo announced plans to limit all cars manufactured from 2020 onwards to a max speed of 112mph. This is part of their plans to bring the number of people who die in a Volvo car to zero over the next coming years.

In a press release by the company they teased the launch of Vision 2020, “one of the most ambitious safety visions in the automotive industry.”

How will this work?

Most other manufacturers are using an Intelligent Speed Assistant (ISA), which earlier this year was revealed as near finalised that it would be mandatory for all new cars on the road from 2021. The European Transport Safety Council proposed the changes which were approved by a key group of MEPs and is hoped to come into force for all cars with the 21 plate and higher.

ISA will limit the speed of the car depending on the area the car is. It uses GPS and traffic sign recognition to limit and adjust the max speed. Drivers are able to override the max speed limit by pushing hard on the throttle, in case of overtaking cars or need to move out of the way sharply.

However, Volvo has gone a step further and will electronically limit the car from going no faster than 112 mph, or 180kph. For the Volvo XC90, the flagship SUV, this will reduce the top speed by 20mph, and many of the other new cars will have their top speeds chopped by 18mph.

<!-- /283405443/PTP_Video_640x442 --><!-- [et_pb_line_break_holder] --><div id='div-gpt-ad-1549281272220-0'><!-- [et_pb_line_break_holder] --><script><!-- [et_pb_line_break_holder] -->googletag.cmd.push(function() { googletag.display('div-gpt-ad-1549281272220-0'); });<!-- [et_pb_line_break_holder] --></script><!-- [et_pb_line_break_holder] --></div><!-- [et_pb_line_break_holder] -->

Zero deaths by 2020?

Volvo’s Vision 2020 is a definite jump in the car safety world. To suddenly go from quite basic systems not even under ten years ago to there now being plans to stop deaths in Volvo cars completely seems a huge leap. Volvo has often been a leader in the safety industry with its calls for a universal safety standard in autonomous vehicles.

However, nearly 1.25 million people a year die in a motor vehicle. Can this ambitious strategy really come to fruition? Volvo has admitted that on technology alone they cannot bring the number of deaths to zero. In light of this, they want to work to change user behaviour as well as improving their technological capabilities.

“Volvo is a leader in safety: we always have been, and we always will be,” said Håkan Samuelsson, president and chief executive of Volvo. “Because of our research, we know where the problem areas are when it comes to ending serious injuries and fatalities in our cars. And while a speed limitation is not a cure-all, it’s worth doing if we can even save one life.”

“We want to start a conversation about whether car makers have the right or maybe even an obligation to install technology in cars that changes their driver´s behaviour, to tackle things like speeding, intoxication or distraction,” said Mr Samuelsson. “We don’t have a firm answer to this question, but believe we should take leadership in the discussion and be a pioneer.”

People simply do not recognise the danger involved in speed, says Jan Ivarsson following on from Mr Samuelsson’s statement, one of Volvo Cars’ leading safety experts.

“As humans, we all understand the dangers with snakes, spiders and heights. With speeds, not so much,” said Mr Ivarsson. “People often drive too fast in a given traffic situation and have poor speed adaption in relation to that traffic situation and their own capabilities as a driver. We need to support better behaviour and help people realise and understand that speeding is dangerous.”

Other safety issues

In the research that Volvo did, they found that there were three gaps in their safety procedures. One being speeding, the other two intoxication and distracted driving. Both of these relate highly to user behaviour over the car, but at a special safety event on March 20th, they plan to reveal solutions for combating these two issues.

With these safety issues also comes the question of intrusiveness. As said earlier do carmakers “have the right or maybe even an obligation to install technology in cars that change their driver’s behaviour?” Is this something that we as people, want to have controlling our lives?

Is Big Brother kicking in or is it ok to have advanced safety features that can change our driving behaviour? The question here must be posed of if we all had perfect driving, these safety features wouldn’t be needed, and we would be able to drive without autonomy taking over.

However, unless a drastic change happens anytime soon, it seems unlikely that people will stop speeding anytime soon. In 2017, 203 people died in a road traffic collision as a direct result of exceeding the speed limit. Every year since 2013, over 200 people have died because of exceeding the speed limit. This anti-speeding advert from New Zealand shows the truly devastating consequences speeding has, we’d recommend watching it, but we will place a warning as it is quite triggering for those who may have been involved in such an incident before.

What do you think about Volvo’s plans? Where does technology stop being able to protect us? Let us know below
You could soon get a £50 fine for doing the school run

Last May, PetrolPrices wrote about how clean air campaigners wanted to ban the car-based school run. With figures showing that a quarter of all cars are on our roads during school drop-off and collection times, a new plan to reduce air pollution—and defend children against poisonous vehicle-related fumes—will now fine parents who drive their children to school.

Hundreds of head teachers are piloting schemes to stop drivers pulling up to the school gates, with £50 fines and even penalties leading to points on their licences for those who snub the ban.

Public health emergency

Schools in Hackney, East London and in Southampton, banned parents from parking at their school entrances just before Christmas, and thousands of other schools are preparing to join the pilot. While the scheme is voluntary at present, campaigners are calling for the ban to become mandatory at all schools and nurseries—something that the almost 2,000 schools and nurseries in areas with dangerous levels of air pollution will welcome.

To help transition parents and children from car to foot, various initiatives are taking place, such as, ‘park and stride’ schemes and the temporary closing of roads.

Some schools are going further to deliver their message, with schoolchildren handing out fake tickets to parents who arrive in cars and others even taking part in ‘playing dead’ protests. Police officers in Solihull, West Midlands are helping the cause by issuing fines to motorists who don’t follow the ban.

While the changes to the school run may anger many time-challenged parents, one cannot dispute the evidence showing the detrimental effect traffic pollution has on our health.

The World Health Organisation (WHO) has described air pollution as a ‘public health emergency’ and their latest figures attribute 4.2 million deaths worldwide every year to ambient air pollution with around 40,000 premature deaths in the UK each year.

The European Environment Agency (EEA) Executive Director Hans Bruyninckx described air pollution as ‘an invisible killer’ and explained that road transport emissions are often more dangerous than those from other sources, as they occur at ground level and in cities, near people. Experts say children are more at risk from pollution because toxins stay inside their bodies longer, and that a ban on parents sitting in their cars at the school gates would have a significant effect on reducing children’s exposure to pollution.

<!-- /283405443/PTP_Video_640x442 --><!-- [et_pb_line_break_holder] --><div id='div-gpt-ad-1549281272220-0' style='height:442px; width:650px;'><!-- [et_pb_line_break_holder] --><script><!-- [et_pb_line_break_holder] -->googletag.cmd.push(function() { googletag.display('div-gpt-ad-1549281272220-0'); });<!-- [et_pb_line_break_holder] --></script><!-- [et_pb_line_break_holder] --></div><!-- [et_pb_line_break_holder] -->

Tragic consequences

Experts know the level of air pollution to be a major risk factor for childhood asthma. In 2017, 1,320 people died of asthma in England and Wales—a 25% rise in one decade.

Alison Cook, Director of Policy and Communications for the British Lung Foundation, said:

“Toxic air is linked to asthma and chronic chest problems, and damage to the lungs in early age is irreversible.

“That’s why illegal levels of pollution around schools is hugely worrying.

“Banning cars from school gates will help reduce pollution in classrooms, but this is just a drop in the ocean. Action on [a] local and national level is needed to help people move to cleaner forms of transport such as walking, cycling and public transport.”

In February 2013, Rosamund Adoo-Kissi-Debrah’s nine-year-old daughter Ella died from an asthma attack.

Ms Kissi-Debrah says the high levels of air pollution where they lived and where Ella went to school, were to blame. The family lived next to one of London’s busiest roads 25 metres from the South Circular Road in Lewisham, South East London.

After Professor Stephen Holgate found spikes in air pollution corresponded with Ella’s 27 asthma-induced hospitalisations episodes, Rosamund campaigned hard and now has approval for a second inquest into her daughter’s death. If conclusive, Ms Kissi-Debrah wants air pollution added to the death certificate. If this happens, it will be the first time air pollution has appeared on a death certificate.

Last year we wrote about the Mayor of London’s plan to reduce vehicle emissions across the capital, by introducing a 24-hour Central London Ultra Low Emission Zone (ULEZ) this April.

Earlier this month, Mayor of London, Sadiq Khan spoke about his new green fund to help schools fight toxic air with ‘pollution barriers’ in the playground.

Mayor of London, Sadiq Khan, said:

“It is unacceptable that our filthy air is affecting the lung growth and respiratory health of our young children, especially those who go to school by busy, polluted roads.

“My funding will help create much needed new spaces for communities to enjoy and help reduce toxic pollution with green barriers in and around schools to protect our children from polluted air.”

‘Just get out and walk’

Many are worried that banning the school run as we know it will only shift the problem elsewhere, but as Jenny Wiles from the walking charity Living Streets said last summer; an awful lot of families live close enough to school to walk the whole way and so where possible they encourage people to ‘just get out and walk and solve the problem completely’.

Some parents might even consider applying for their pre-school children to go to their most local school, negating the need for a car to get there. For those children who live too far from their schools to walk or those in rural areas, free transport is often available.

One thing looks certain; if parents and caregivers don’t make changes to lessen the traffic pollution around schools, somebody else will and the consequences for not complying with the rules could get expensive.

What do you think about the ban on driving children to the school gates? Is it necessary? Are parents time-pressed or lazy? Tell us your views in the comments.

Latest diesels aren’t actually that dirty, new tests show

This is the tale of conflicting opinions, misinformation, financial burden and innovation; no, not the plot from the latest blockbuster, but the demonisation of diesel. Or perhaps the non-demonisation, and therein lies the problem.

Diesel was hailed as the saviour of the planet once, only for it to be proven to be quite the opposite, that it was directly responsible for health problems, poor air quality and premature deaths. Environmental groups looked to discredit it at every opportunity, while other organisations told us that it wasn’t actually that bad.

A raft of legislation was introduced to combat the scourge, and as such, diesel vehicles are all but dead and buried. Except here we are in 2019, and another independent study tells us that the one thing diesels are known for (NOx emissions) may not be a ‘thing’.

Confusion reigns

Just last year, we wrote that the business secretary, Greg Clark, said that despite the ongoing saga of diesel fuel, there is still a place for diesel vehicles, but just a few months later, we’re also reporting that the Ultra-low Emission Zones are being introduced and widened to encompass more of the City of London, particularly targeting diesel, including extra parking charges. It seems that not everyone got the message.

If you’re looking at a new car for the March registration, it would be a brave choice to consider diesel right now.

And yet, a new study by ADAC, Germany’s equivalent of the AA, looked at NOx emissions for 13 of the latest diesel cars available, and their findings suggest that NOx emissions are not just complying with Euro 6 legislation, they’re virtually non-existent.

All thirteen cars were tested at the ADAC laboratory, where they test hundreds of cars each year, and all thirteen were found to be significantly less than the legislation demands, in some cases there were no trace elements of NOx measurable. A number of diesel vehicles all produced less NOx than their petrol equivalent.

It’s worth noting that we aren’t talking about asthmatic, 3-cylinder sub-1 litre engines either – the cleanest vehicle was the Mercedes-Benz C-Class 220d with a 2.0 litre turbodiesel engine (0mg/km), closely followed by the BMW 520d Touring and Vauxhall Astra 1.6D, both 1mg/km.

<!-- /283405443/PTP_Video_640x442 --><!-- [et_pb_line_break_holder] --><div id='div-gpt-ad-1549281272220-0' style='height:442px; width:650px;'><!-- [et_pb_line_break_holder] --><script><!-- [et_pb_line_break_holder] -->googletag.cmd.push(function() { googletag.display('div-gpt-ad-1549281272220-0'); });<!-- [et_pb_line_break_holder] --></script><!-- [et_pb_line_break_holder] --></div><!-- [et_pb_line_break_holder] -->

Real world

Currently, the legal limit is 80mg/km for diesel NOx, but thanks to the 2.1x ‘conformity factor’ the permissible limit is set at 168mg/km until 2020, it will then drop to 1.5x the limit, although there are some legal wrangling’s that could have an impact on that.

As to what this means in the real world … it’s difficult to say. Opinions on diesel fuel have swung like a pendulum over the years, and we’re still waiting to see where that pendulum stops. It’s the uncertainty throughout the industry and government that has led to a decline in sales; thanks to unreasonable taxation due to emission misinformation mainly.

Admittedly, the manufacturers haven’t helped the situation with their knack of extending ranges and minimising emissions. There also seems to be a leaning toward seeing the motorist as easy prey, and the murkier the water, the harder it is to prove a clear case for using diesel vehicles, or at least for not punishing anyone taking the incentivised deals when the government invited them to.

If this new breed of diesel engined vehicles proves to be as clean as ADAC say they are, what would this mean to the ever-increasing charges – T-Zone, congestion charge, ULEZ, VED, parking and fuel? Would there be a relaxation of the relentless pursuit?

Purchasing

Diesel car sales have fallen significantly in the last few years; industry experts say sales dropped by at least 25% in 2018; buyers are being scared off by the unknown, and the extra cost. But could a diesel still work for you?

It’s true that indirect costs are rising, but a modern diesel will be ULEZ safe, and thanks to the fall in sales numbers, they’ve never been cheaper to purchase. Of course, there is a shift away from not just diesel, but internal combustion, so electric vehicles are on the rise, but they don’t quite work for all situations, and that’s before we look at cost implications.

There’s no simple answer as to whether a diesel vehicle is the right choice for you, but there are some considerations to think of – are you a high mileage driver? Are you towing a caravan or trailer regularly? Prefer a big SUV rather than a sporty saloon? Then a diesel could still work for you.

While PetrolPrices.com is, of course, a pro-motoring site, we understand the value of being impartial, of reporting on stories that could have conflicting opinions (diesel especially). It’s for this reason that you’ll find a range of articles regarding diesel, be they pro or anti; purely in the interest of bringing you a balanced view.

Would you consider purchasing a new diesel vehicle in March? Can the manufacturers be trusted to bring us new technology without exaggerating the benefit? Let us know in the comments.

Tax it or lose it as DVLA reinforces its policies

New DVLA stats released earlier in the week show that over 460,000 vehicles in 11 cities nationwide are clamped or fined yearly for failing to tax their cars.

The new advertising campaign targets 11 areas nationwide where the highest number of untaxed vehicles were found. It aims to raise awareness about what not taxing your vehicles will lead to, whether that is a fine, penalty or it being clamped and potentially towed.

Worst areas for clamping

The 11 areas chosen to be targeted for this advert are based on the numbers for enforcement actions taken in 2018, whether that is a penalty, fine or clamping.

Perhaps unsurprisingly, London was the worst for untaxed vehicles across the UK. Whether this is down to higher numbers of CCTV cameras, a higher proportion of people packed into the area, or merely because there simply are more people not taxing their cars in London it is very unknown.

However, the high contrast between London and the rest of the UK, over 50,000 more than anywhere else, shows the drastic need to crack down on untaxed motorists.

<!-- /283405443/PTP_Video_640x442 --><!-- [et_pb_line_break_holder] --><div id='div-gpt-ad-1549281272220-0' style='height:442px; width:650px;'><!-- [et_pb_line_break_holder] --><script><!-- [et_pb_line_break_holder] -->googletag.cmd.push(function() { googletag.display('div-gpt-ad-1549281272220-0'); });<!-- [et_pb_line_break_holder] --></script><!-- [et_pb_line_break_holder] --></div><!-- [et_pb_line_break_holder] -->
<table><!-- [et_pb_line_break_holder] --> <tr><!-- [et_pb_line_break_holder] --> <th>Area</th><!-- [et_pb_line_break_holder] --> <th>Clamped</th><!-- [et_pb_line_break_holder] --> <th>Fines or Penalties</th><!-- [et_pb_line_break_holder] --> <th>Totals</th><!-- [et_pb_line_break_holder] --> </tr><!-- [et_pb_line_break_holder] --> <tr><!-- [et_pb_line_break_holder] --> <td>London</td><!-- [et_pb_line_break_holder] --> <td>27,605</td><!-- [et_pb_line_break_holder] --> <td>94,550</td><!-- [et_pb_line_break_holder] --> <td>122,155</td><!-- [et_pb_line_break_holder] --> </tr><!-- [et_pb_line_break_holder] --> <tr><!-- [et_pb_line_break_holder] --> <td>Northern Ireland</td><!-- [et_pb_line_break_holder] --> <td>5,516</td><!-- [et_pb_line_break_holder] --> <td>67,944</td><!-- [et_pb_line_break_holder] --> <td>73,460</td><!-- [et_pb_line_break_holder] --> </tr><!-- [et_pb_line_break_holder] --> <tr><!-- [et_pb_line_break_holder] --> <td>Birmingham</td><!-- [et_pb_line_break_holder] --> <td>5,076</td><!-- [et_pb_line_break_holder] --> <td>50,045</td><!-- [et_pb_line_break_holder] --> <td>55,121</td><!-- [et_pb_line_break_holder] --> </tr><!-- [et_pb_line_break_holder] --> <tr><!-- [et_pb_line_break_holder] --> <td>Manchester</td><!-- [et_pb_line_break_holder] --> <td>7,573</td><!-- [et_pb_line_break_holder] --> <td>26,214</td><!-- [et_pb_line_break_holder] --> <td>33,787</td><!-- [et_pb_line_break_holder] --> </tr><!-- [et_pb_line_break_holder] --> <tr><!-- [et_pb_line_break_holder] --> <td>Glasgow</td><!-- [et_pb_line_break_holder] --> <td>2,666</td><!-- [et_pb_line_break_holder] --> <td>29,705</td><!-- [et_pb_line_break_holder] --> <td>32,371</td><!-- [et_pb_line_break_holder] --> </tr><!-- [et_pb_line_break_holder] --> <tr><!-- [et_pb_line_break_holder] --> <td>Sheffield</td><!-- [et_pb_line_break_holder] --> <td>3,987</td><!-- [et_pb_line_break_holder] --> <td>25,291</td><!-- [et_pb_line_break_holder] --> <td>29,278</td><!-- [et_pb_line_break_holder] --> </tr><!-- [et_pb_line_break_holder] --> <tr><!-- [et_pb_line_break_holder] --> <td>Cardiff</td><!-- [et_pb_line_break_holder] --> <td>3,021</td><!-- [et_pb_line_break_holder] --> <td>24,598</td><!-- [et_pb_line_break_holder] --> <td>27,619</td><!-- [et_pb_line_break_holder] --> </tr><!-- [et_pb_line_break_holder] --> <tr><!-- [et_pb_line_break_holder] --> <td>Nottingham</td><!-- [et_pb_line_break_holder] --> <td>3,507</td><!-- [et_pb_line_break_holder] --> <td>21,346</td><!-- [et_pb_line_break_holder] --> <td>24,853</td><!-- [et_pb_line_break_holder] --> </tr><!-- [et_pb_line_break_holder] --> <tr><!-- [et_pb_line_break_holder] --> <td>Bristol</td><!-- [et_pb_line_break_holder] --> <td>3,496</td><!-- [et_pb_line_break_holder] --> <td>20,412</td><!-- [et_pb_line_break_holder] --> <td>23,908</td><!-- [et_pb_line_break_holder] --> </tr><!-- [et_pb_line_break_holder] --> <tr><!-- [et_pb_line_break_holder] --> <td>Leicester</td><!-- [et_pb_line_break_holder] --> <td>3,344</td><!-- [et_pb_line_break_holder] --> <td>19,196</td><!-- [et_pb_line_break_holder] --> <td>22,540</td><!-- [et_pb_line_break_holder] --> </tr><!-- [et_pb_line_break_holder] --> <tr><!-- [et_pb_line_break_holder] --> <td>Coventry</td><!-- [et_pb_line_break_holder] --> <td>1,257</td><!-- [et_pb_line_break_holder] --> <td>18,193</td><!-- [et_pb_line_break_holder] --> <td>19,450</td><!-- [et_pb_line_break_holder] --> </tr><!-- [et_pb_line_break_holder] --></table><!-- [et_pb_line_break_holder] --><em> Data taken from DVLA website and used under Open Government Licence v3.0 for editorial purposes only.</em>

Removal of paper discs

Back in 2014, the DVLA removed paper tax discs, saying that an online database was a more cost-effective way forward, saving the Treasury around £10 million a year.

The lost revenue from the higher number of people not taxing their cars is predicted to be over £100 million, which is going to be a quarter of a million a year lost on average. Since 2014, experts approximate that the number of people not taxing their vehicles has increased by 28%.

Every two years the DVLA publish a report into Vehicle Excise Duty (VED) evasion statistics. The last report published in 2017 showed a drastic increase in vehicle stats compared to 2015, with a statistically significant increase of over 1%. Administrative factors such as the removal of paper tax discs were attributed along with the removal of automatic tax transfer when you the vehicle changes hands.

However, an increase from 0.6% untaxed in traffic figure in 2013 to 1.4% in 2015 and then 1.8% in 2017 shows that all the factors combined have not been as successful as perhaps thought. While these figures may seem small, 1.8% of the market equals around 755,000 vehicles on our roads.

Hence the reason for the new DVLA campaign. They’re hoping that by showing the stark consequences of not taxing your vehicle and reminding people how easy it is, they may be able to lower this figure.

Used under Open Government Licence v3.0 for editorial purposes only.

DVLA Head of Enforcement Tim Burton said: “This campaign has a clear message for anyone who flouts the law in this way – tax it or lose it. It’s never been easier to tax your car, so there really is no excuse. We would rather not have to clamp or remove vehicles, but this campaign highlights the consequences of not taxing a vehicle. Having your vehicle clamped is expensive and inconvenient – and you could end up losing your car.”

Tax changes recently

In April 2017, the DVLA changed tax figures by introducing higher rates for newly registered vehicles and in last years budget, they secretly announced that it would increase in line with RPI.

It was also announced that VED would be ringfenced for the Strategic Road Network, essentially building more smart motorways and major roads. This comes into effect on April 2019 and is the third year in a row that VED has increased.

What do you think of the findings? Do you think that less people have taxed their cars since the removal of tax discs? Will this new campaign help? Let us know what you think

70% of drivers don’t know what to do when they see this sign

We’re sure that most of our readers have heard the legend of Hackney Carriages having to carry a bale of hay and some oats for their horse (and contrary to popular belief, it was dropped from law in 1976), but traffic laws and road legislation in the UK are some of the most comprehensive in Europe, so it’s no surprise that many drivers can’t quite recall every one of our numerous road signs.

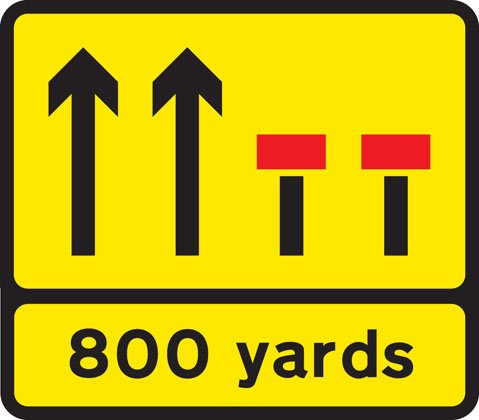
A survey of 22,000 motorists by Halfords Autocentres has revealed that 70% of drivers can’t correctly identify the meaning of this sign (right, used for illustrative purposes and may not reflect actual real-life signs).

Zip merging

The sign is used on motorways and dual carriageways, it shows that one lane ahead is blocked by an obstruction, but the confusion comes from understanding the next action. Pulling over into the next lane as soon as it’s possible is the majority choice, but one that is technically wrong.

What the sign is actually telling you to do is to continue driving in the lane until you’ve almost reached the merge point, then slowly ‘zip merge’ into the clear lane, where it’s safe and clear to do so. Just 27% of drivers knew the correct meaning in the survey, the last three percent believed that ‘straddling both lanes, blocking vehicles from reaching the head of the queue’ was acceptable.

Another survey by a national tyre chain also found that one in five road signs are a mystery to the average driver.

Avoidable breakdowns

The survey by Halfords was carried out as part of a roadworthiness campaign, but the fact that there are typically 85,000 breakdowns each year, with an estimated 40% being preventable isn’t what’s at interest here, this is more about driver education and habits.

36% of motorists admit to never reading the Highway Code once they’ve passed their driving test, and 20% of drivers haven’t read it within the last decade, is it a wonder that identifying signs isn’t at the forefront of their thoughts?

It seems easy to understand a great many of road signs, the ones we see daily are perhaps even ignored, only ever taking notice of ones that are clearly warning of danger, but while we may have a basic understanding of what they mean, could we 100% positively identify the sign and the textbook meaning? It’s doubtful.

Some years ago, AutoExpress polled 1,000 readers, 90% thought that driving standards were falling, but only 15% of respondents felt their driving standard had dropped, perhaps a brush-up on the Highway Code could help to change that thinking?

<!-- /283405443/PTP_Video_640x442 --><!-- [et_pb_line_break_holder] --><div id='div-gpt-ad-1549281272220-0' style='height:442px; width:650px;'><!-- [et_pb_line_break_holder] --><script><!-- [et_pb_line_break_holder] -->googletag.cmd.push(function() { googletag.display('div-gpt-ad-1549281272220-0'); });<!-- [et_pb_line_break_holder] --></script><!-- [et_pb_line_break_holder] --></div><!-- [et_pb_line_break_holder] -->

Highway code

While it’s easy to think that the Highway Code hasn’t changed significantly, you may be surprised to hear that in the last three years alone, there have been 48 updates to it, including changes to the MOT regulations, learner driver laws and penalties for using a handheld device.

With some organisations calling for more regular eye tests as part of an ongoing campaign to increase road safety, perhaps part of the test should include a brush-up on the Highway Code, or at least the changing road signs to help with awareness of what they all mean and how to respond correctly.

While it could be argued that the sign in question and the lack of knowledge regarding it is purely a case of semantics, the fact is that swapping lanes prematurely could actually increase congestion in the build-up to the blockage, and that’s before we get to the highly inconsiderate act of blocking the road so other drivers can’t ‘queue jump’.

It’s frustrating to see other motorists policing the roads themselves, the Police always advise against such actions, and yet drivers continue to act in such a manner. Maybe it’s those drivers that should be labelled as un-thinking or selfish, rather than the drivers happily going about their business, in full compliance of the law?

Bedtime reading

If you’re one of the 36% of drivers that haven’t read the Highway Code since passing your test, or even if you haven’t picked up a copy in the last five years, it could be worthwhile to familiarise yourself with the latest regulations and driving standards.

It’s unlikely that anyone will learn the full meaning and action of all 100+ road signs, but it’s a useful exercise in updating your own knowledge-base, and who knows, you may learn something new.
Should you wish to take part in the Halfords survey, you can find that here; please note that PetrolPrices has not been paid to endorse this survey, and has no affiliation with the survey or the creators and promoters. We put such links in at the interest of our readers.

Do you think that driving standards are falling? Should the average motorist know the meaning and action of all road signs? Will you share your result from the test? Let us know in the comments.

London scrappage scheme: PR stunt or helping hand?

In just seven weeks, a new daily charge is to be introduced for entering the City of London, it will affect all pre-Euro 4 petrol vehicles and pre-Euro 6 diesels, with no resident discount nor blue badge exemption, it’s thought that up to 2.5 million vehicles could be affected.

Unlike the congestion charge, this new tax will be levied 24-hours a day, 365 days a year, but to offset the tax, there will be a London-only vehicle scrappage scheme implemented for families on ‘low incomes’. According to Sadiq Khan, Mayor of London, the air quality in London is “a national disgrace”.

£25 million

Around 28% of people living in London are in poverty, and with London’s public transport costs being some of the most expensive in the world, many rely on their car for commuting, shopping and emergencies, more so than in other parts of the country.

But with the roll-out of the new Ultra Low Emission Zone, it’s thought that around 25,000 people per day could be expected to pay a further £4,550 per year to enter the city, and in October 2021, the scheme will spread to cover everything in-between the North and South Circular Road.

To avoid pushing families in to further poverty, a new car scrappage scheme will be introduced for those on low incomes, although no details have yet been published, aside from the headline grabbing ‘£25 million scheme’.

£10 per vehicle

The headline figure doesn’t seem that impressive when you realise that it equates to just £10 per vehicle in real terms, but the devil is in the (unpublished) detail.

As a bare minimum, a vehicle will need to be manufactured from around 2006 onwards for unleaded (forget diesel – 2015/16 or newer), and when demand squeezes the supply network, prices will inevitably rise.

It’s unlikely that the scrappage scheme will be paying cold hard cash to allow for a private purchase, which pushes the consumer to buy through a business, with an already fair mark-up on the vehicle but there will be an increase in paperwork for the dealer, which of course increases their overhead – so prices will rise further, or the quality of the product will reduce, meaning that a buyer will be getting a lesser deal either way.

Even working to a payment of just £500 per vehicle, that would only allow 50,000 vehicles to be swapped, to put that into perspective, that’s just 2% of the affected vehicles. The next question would be what kind of vehicle can you buy from a car dealer for £500?

<!-- /283405443/PTP_Video_640x442 --><!-- [et_pb_line_break_holder] --><div id='div-gpt-ad-1549281272220-0' style='height:442px; width:650px;'><!-- [et_pb_line_break_holder] --><script><!-- [et_pb_line_break_holder] -->googletag.cmd.push(function() { googletag.display('div-gpt-ad-1549281272220-0'); });<!-- [et_pb_line_break_holder] --></script><!-- [et_pb_line_break_holder] --></div><!-- [et_pb_line_break_holder] -->

25,000 per day

It’s thought that 25,000 vehicles each day would be liable for the extra tax, which over a five day week would equate to £1,562,500, or just over £80 million per year, that’s before congestion charging is taken into account.

Official sources will tell you that the congestion charge is a success; private car usage has fallen by around 39% since the introduction of it, but that doesn’t tell the complete picture – private hire vehicles, taxis and Uber use has increased by around 29%, it’s the increase in these vehicles that has led to journey times on public transport being extended, which of course has led to a decline in the number of people using public transport as it’s seen as too unreliable. Despite the volume of traffic being less, the average journey time has still increased, the speed of traffic has reduced further.

In 2017, TfL registered the first drop in revenue for the congestion charging zone, they also lost the £700 million / year operational grant from the government, and Sadiq Khan promised to freeze public transport fares, at a cost of £640 million, despite passenger numbers and fare revenue being down by £240 million.

Could there be an extra motive behind the Ultra Low Emission Zone charging? And the extension of that?

Clean air

Nobody is denying that air quality is an issue, and measures should be put in to place to tackle it, but hitting the poorest families that are reliant on their vehicle to just survive shouldn’t be part of the equation.

With plans in place to charge employees parking at work, congestion charging, and ULEZ charges, owning a car has never been more expensive, and despite the Mayor of London trying to sugar coat it, the pill is very bitter to swallow.

Town centres are dying, a further 16 city representatives were at the Clean Air Summit where Khan announced his plans, they were all in agreement that the motorist should bear the brunt of the cost to clean up the pollution, but what happens when dirty vehicles are replaced with clean? Who will pay then?

What do you think of the vehicle scrappage scheme? Is it a genuine effort to help the poorest, or merely sugar-coating the pill? Let us know in the comments.

It’s quicker to cycle than drive in UK cities, says report

As UK roads get more and more congested, it seems that some drivers will have to become what they have, on the whole, despised for years. A cyclist. INRIX is saying it could now be quicker to cycle than to drive if you commute into a city centre.

In many major UK cities, cars are travelling slower than the average cyclist does on the last mile of their journey. A new report by INRIX, a big data company specialising in roads, found that it was quicker to cycle than to drive, based on last mile speed in 6 major UK cities.

UK wide picture

On average, drivers in the UK lost 178 hours yearly due to congestion, costing the UK £7.9 billion over the year. For an average UK driver, this is £1317, an impressive amount when you look at it.

Six cities across the UK had an average last mile speed of 10mph or less, and when the average cyclist does 9.6mph, it seems almost ridiculous to carry on driving. While for some they may not be able to drive, for those who have adequate facilities at workplaces or live close enough to walk/cycle, it seems a much better option. In six UK cities, you’d actually travel faster by bicycle than a car.

In Central London, Sadiq Khan, Mayor of London, wants 80% of journeys into the city centre to be by public transport, walking or cycling by 2041. At the moment, people are avoiding public transport finding it to be unreliable slow, or not getting them there when they need it to be.

As the table below shows, unsurprisingly London has the highest cost of congestion per driver, and the highest time lost due to congestion. Birmingham came in second in the UK but placed 51st in the overall worldwide ranking, much better than London’s 6th place.

Leeds congestion increased by 6% over the year, and one traffic campaigner from Leeds cited the evergrowing number of single drivers entering and crossing the city centre. Rob Greenland, co-director of Social Business Brokers, said to the Yorkshire Post “The cause of the near-daily congestion isn’t … a car broken down on the inner ring road, or whatever today’s excuse is. It’s the fact that there are too many people travelling alone in cars, so that when there’s a problem (traffic light failure, collision, broken down car) the system collapses. There is no resilience – because too many of us are travelling in a way that the system just can’t cope with.”

<table><!-- [et_pb_line_break_holder] --> <tr><!-- [et_pb_line_break_holder] --> <th>URBAN AREA</th><!-- [et_pb_line_break_holder] --> <th>2018 WORLDWIDE IMPACT RANKING (2017)</th><!-- [et_pb_line_break_holder] --> <th>HOURS LOST IN CONGESTION</th><!-- [et_pb_line_break_holder] --> <th>COST OF CONGESTION (PER DRIVER)</th><!-- [et_pb_line_break_holder] --> <th>INNER CITY LAST MILE SPEED (MPH)</th><!-- [et_pb_line_break_holder] --> </tr><!-- [et_pb_line_break_holder] --> <tr><!-- [et_pb_line_break_holder] --> <td>London</td><!-- [et_pb_line_break_holder] --> <td>6 (6)</td><!-- [et_pb_line_break_holder] --> <td>227 (6)</td><!-- [et_pb_line_break_holder] --> <td>£1,680</td><!-- [et_pb_line_break_holder] --> <td>7</td><!-- [et_pb_line_break_holder] --> </tr><!-- [et_pb_line_break_holder] --> <tr><!-- [et_pb_line_break_holder] --> <td>Birmingham</td><!-- [et_pb_line_break_holder] --> <td>51 (52)</td><!-- [et_pb_line_break_holder] --> <td>134 (68)</td><!-- [et_pb_line_break_holder] --> <td>£994</td><!-- [et_pb_line_break_holder] --> <td>12</td><!-- [et_pb_line_break_holder] --> </tr><!-- [et_pb_line_break_holder] --> <tr><!-- [et_pb_line_break_holder] --> <td>Glasgow</td><!-- [et_pb_line_break_holder] --> <td>54 (57)</td><!-- [et_pb_line_break_holder] --> <td>99 (117)</td><!-- [et_pb_line_break_holder] --> <td>£736</td><!-- [et_pb_line_break_holder] --> <td>11</td><!-- [et_pb_line_break_holder] --> </tr><!-- [et_pb_line_break_holder] --> <tr><!-- [et_pb_line_break_holder] --> <td>Manchester</td><!-- [et_pb_line_break_holder] --> <td>85 (92)</td><!-- [et_pb_line_break_holder] --> <td>156 (34)</td><!-- [et_pb_line_break_holder] --> <td>£1,157</td><!-- [et_pb_line_break_holder] --> <td>10</td><!-- [et_pb_line_break_holder] --> </tr><!-- [et_pb_line_break_holder] --> <tr><!-- [et_pb_line_break_holder] --> <td>Bristol</td><!-- [et_pb_line_break_holder] --> <td>86 (90)</td><!-- [et_pb_line_break_holder] --> <td>149 (45)</td><!-- [et_pb_line_break_holder] --> <td>£1,099</td><!-- [et_pb_line_break_holder] --> <td>8</td><!-- [et_pb_line_break_holder] --> </tr><!-- [et_pb_line_break_holder] --> <tr><!-- [et_pb_line_break_holder] --> <td>Edinburgh</td><!-- [et_pb_line_break_holder] --> <td>87 (79)</td><!-- [et_pb_line_break_holder] --> <td>165 (24)</td><!-- [et_pb_line_break_holder] --> <td>£1,219</td><!-- [et_pb_line_break_holder] --> <td>8</td><!-- [et_pb_line_break_holder] --> </tr><!-- [et_pb_line_break_holder] --> <tr><!-- [et_pb_line_break_holder] --> <td>Sheffield</td><!-- [et_pb_line_break_holder] --> <td>90 (93)</td><!-- [et_pb_line_break_holder] --> <td>149 (44)</td><!-- [et_pb_line_break_holder] --> <td>£1,101</td><!-- [et_pb_line_break_holder] --> <td>10</td><!-- [et_pb_line_break_holder] --> </tr><!-- [et_pb_line_break_holder] --> <tr><!-- [et_pb_line_break_holder] --> <td>Leicester</td><!-- [et_pb_line_break_holder] --> <td>98 (98)</td><!-- [et_pb_line_break_holder] --> <td>155 (37)</td><!-- [et_pb_line_break_holder] --> <td>£1,145</td><!-- [et_pb_line_break_holder] --> <td>11</td><!-- [et_pb_line_break_holder] --> </tr><!-- [et_pb_line_break_holder] --> <tr><!-- [et_pb_line_break_holder] --> <td>Leeds</td><!-- [et_pb_line_break_holder] --> <td>101 (106)</td><!-- [et_pb_line_break_holder] --> <td>143 (52)</td><!-- [et_pb_line_break_holder] --> <td>£1,057</td><!-- [et_pb_line_break_holder] --> <td>13</td><!-- [et_pb_line_break_holder] --> </tr><!-- [et_pb_line_break_holder] --> <tr><!-- [et_pb_line_break_holder] --> <td>Liverpool</td><!-- [et_pb_line_break_holder] --> <td>104 (91)</td><!-- [et_pb_line_break_holder] --> <td>119 (85)</td><!-- [et_pb_line_break_holder] --> <td>£878</td><!-- [et_pb_line_break_holder] --> <td>10</td><!-- [et_pb_line_break_holder] --> </tr><!-- [et_pb_line_break_holder] --> <tr><!-- [et_pb_line_break_holder] --> <td>Belfast</td><!-- [et_pb_line_break_holder] --> <td>121 (112)</td><!-- [et_pb_line_break_holder] --> <td>190 (16)</td><!-- [et_pb_line_break_holder] --> <td>£1,406</td><!-- [et_pb_line_break_holder] --> <td>8</td><!-- [et_pb_line_break_holder] --> </tr><!-- [et_pb_line_break_holder] --> <tr><!-- [et_pb_line_break_holder] --> <td>Cardiff</td><!-- [et_pb_line_break_holder] --> <td>131 (123)</td><!-- [et_pb_line_break_holder] --> <td>143 (53)</td><!-- [et_pb_line_break_holder] --> <td>£1,056</td><!-- [et_pb_line_break_holder] --> <td>9</td><!-- [et_pb_line_break_holder] --> </tr><!-- [et_pb_line_break_holder] --> <tr><!-- [et_pb_line_break_holder] --> <td>Nottingham</td><!-- [et_pb_line_break_holder] --> <td>140 (136)</td><!-- [et_pb_line_break_holder] --> <td>149 (43)</td><!-- [et_pb_line_break_holder] --> <td>£1,101</td><!-- [et_pb_line_break_holder] --> <td>10</td><!-- [et_pb_line_break_holder] --> </tr><!-- [et_pb_line_break_holder] --> <tr><!-- [et_pb_line_break_holder] --> <td>Hull</td><!-- [et_pb_line_break_holder] --> <td>142 (138)</td><!-- [et_pb_line_break_holder] --> <td>151 (41)</td><!-- [et_pb_line_break_holder] --> <td>£1,118</td><!-- [et_pb_line_break_holder] --> <td>12</td><!-- [et_pb_line_break_holder] --> </tr><!-- [et_pb_line_break_holder] --> <tr><!-- [et_pb_line_break_holder] --> <td>Newcastle</td><!-- [et_pb_line_break_holder] --> <td>147 (143)</td><!-- [et_pb_line_break_holder] --> <td>90 (135)</td><!-- [et_pb_line_break_holder] --> <td>£666</td><!-- [et_pb_line_break_holder] --> <td>19</td><!-- [et_pb_line_break_holder] --> </tr><!-- [et_pb_line_break_holder] --> <tr><!-- [et_pb_line_break_holder] --> <td>Coventry</td><!-- [et_pb_line_break_holder] --> <td>167 (177)</td><!-- [et_pb_line_break_holder] --> <td>90 (134)</td><!-- [et_pb_line_break_holder] --> <td>£666</td><!-- [et_pb_line_break_holder] --> <td>17</td><!-- [et_pb_line_break_holder] --> </tr><!-- [et_pb_line_break_holder] --> <tr><!-- [et_pb_line_break_holder] --> <td>Stoke-on-Trent</td><!-- [et_pb_line_break_holder] --> <td>168 (165)</td><!-- [et_pb_line_break_holder] --> <td>107 (102)</td><!-- [et_pb_line_break_holder] --> <td>£794</td><!-- [et_pb_line_break_holder] --> <td>14</td><!-- [et_pb_line_break_holder] --> </tr><!-- [et_pb_line_break_holder] --> <tr><!-- [et_pb_line_break_holder] --> <td>Southampton</td><!-- [et_pb_line_break_holder] --> <td>173 (176)</td><!-- [et_pb_line_break_holder] --> <td>111 (96)</td><!-- [et_pb_line_break_holder] --> <td>£821</td><!-- [et_pb_line_break_holder] --> <td>11</td><!-- [et_pb_line_break_holder] --> </tr><!-- [et_pb_line_break_holder] --> <tr><!-- [et_pb_line_break_holder] --> <td>Swansea</td><!-- [et_pb_line_break_holder] --> <td>191 (191)</td><!-- [et_pb_line_break_holder] --> <td>95 (126)</td><!-- [et_pb_line_break_holder] --> <td>£704</td><!-- [et_pb_line_break_holder] --> <td>10</td><!-- [et_pb_line_break_holder] --> </tr><!-- [et_pb_line_break_holder] --></table><!-- [et_pb_line_break_holder] --> <em> Data taken from <a href="http://inrix.com/scorecard/">INRIX Global Traffic Scorecard</a>. Used for editorial purposes only.</em><!-- [et_pb_line_break_holder] -->
<!-- /283405443/PTP_Video_640x442 --><!-- [et_pb_line_break_holder] --><div id='div-gpt-ad-1549281272220-0' style='height:442px; width:650px;'><!-- [et_pb_line_break_holder] --><script><!-- [et_pb_line_break_holder] -->googletag.cmd.push(function() { googletag.display('div-gpt-ad-1549281272220-0'); });<!-- [et_pb_line_break_holder] --></script><!-- [et_pb_line_break_holder] --></div><!-- [et_pb_line_break_holder] -->

UK vs the World

While London placed 6th overall, the rest of the UK fared better, with Birmingham coming in a respectable 51st and Glasgow in 54th.

For comparison, Dublin did not do well at all, as the city actually had the slowest last mile travel speed of any city worldwide, which is “The time it takes to travel one mile into the central business district during peak hours.” On average, you would drive at 6mph in the centre of Dublin during peak times, which is the worst of any city and urban area in the UK!

Last month, we told you about NICE wanting to give cyclists and pedestrians priority on roads, and so it seems that over the next twenty years, cities across the world will be designed with cyclists and other forms of transport over cars, as they help to reduce congestion in major cities, and you’ll go faster in a fair few of them.

Commenting on the report , Glynn Barton, Director of Network Management at TfL, said: “We are taking bold action to reduce congestion and improve London’s poor air quality. This includes removing the Congestion Charge exemption for private hire vehicles and reducing the time taken to clear up unplanned incidents, ensuring that roadworks by utilities companies and others are better coordinated. We are also working with the freight industry to encourage more efficient deliveries across the capital.”

“To directly tackle poor air quality, we are ensuring that buses, taxis and private hire vehicles are as green as possible, alongside the introduction of the Ultra-Low Emission Zone this April. In delivering the Mayor’s ambitious plans for 80 per cent of all journeys to be made by public transport, walking or cycling by 2041, our plans will further help tackle congestion across London.”

Worst UK roads to drive on

In rush hour the worst UK road was the A406 from the Chiswick Roundabout to Hanger Lane, with a daily delay of 15 minutes. The A406 also pops up further down the list in spot 6, with the congestion from the A1 to the A10 having a daily delay of 11 minutes. At peak travel time in London, the average mph was just 15.58 mph, and a reasonably fit cyclist can do up to 25mph on their commute, so it might be quicker to cycle for you if you live in a city centre.

Fifteen minutes daily may not seem like much, but over a year it equals to 61 hours for someone doing a daily journey, just over two and a half days.

In Leeds the Leeds Road/Saltaire Road was the worst, with the section between the Harrogate Road and the Bradford Road having a daily delay of 11 minutes, equaling 44 hours over the year.

Would you consider cycling to work if you knew it would save you time and money? Do you think cities should be doing more to reduce congestion? Let us know below

The smaller the car, the more reliable it is says Which?

Choosing the right car for you can be a mixture of sensible decision, financial obligation and with a hint of raw emotion, but even the prettiest of cars will be given the cold shoulder in the cold hard light of reliability statistics.

A new survey by Which? has concluded that the Luxury and SUV class of cars are more unreliable than small city cars, by some margin.

The short version is that when dealing with cars up to three-years-old, the more money you spend, the more likely it is that you’ll have reliability problems.

Reliability statistics

Which? have surveyed the owners of approximately 51,000 vehicles, they found that luxury vehicles like the BMW 5 & 7 Series or the Mercedes-Benz E and S-Class spent, on average, 2.58 days off the road last year and that the reliability affected 32% of the vehicles.

Compare that to a small city car, like the Toyota Aygo, and the figure drops to just 17% of vehicles, with a shorter time off the road – 1.26 days typically.

The next most common class for faults was the sports-utility vehicle – 27% suffered faults with an average of 2 days in the garage.

Surveys

On the face of it, the study by Which? does seem to hold some valid information, but the missing link in the survey is manufacturer – many of the larger brands can offer you a range of vehicles, from small city car through to SUV, so could it be a manufacturing problem rather than a specific vehicle category?

A study by Auto Express revealed that the top three ‘Most Reliable Manufacturers’ are Lexus, Jaguar and Mercedes-Benz – all luxury and SUV, compare that to their findings for the least reliable – Dacia, Vauxhall and Chevrolet – brands not exactly known for their luxury or SUV offerings.

Of course, there are exceptions – Mercedes make the A-Class for example, and Chevrolet make a number of SUVs, albeit rebadged Opel’s, which we’d know better as Vauxhall, so that would fit with the Auto Express poll – both Vauxhall and Chevy occupying the bottom two spots.

<!-- /283405443/PTP_Video_640x442 --><!-- [et_pb_line_break_holder] --><div id='div-gpt-ad-1549281272220-0' style='height:442px; width:650px;'><!-- [et_pb_line_break_holder] --><script><!-- [et_pb_line_break_holder] -->googletag.cmd.push(function() { googletag.display('div-gpt-ad-1549281272220-0'); });<!-- [et_pb_line_break_holder] --></script><!-- [et_pb_line_break_holder] --></div><!-- [et_pb_line_break_holder] -->

Car reliability

With regulations on nearly every aspect of a car getting tighter – crash survivability, functionality, emissions, economy and performance, coupled with the need to incorporate more technology for in-car entertainment, safety or ‘luxury’, the amount of electronic equipment fitted has increased dramatically over the last decade, perhaps more so over the last 5-years.

Also, it’s ‘technology’ that seems to lead the way for the reliability problems – onboard software, in-car entertainment, built-in satnav, electrically controlled components (windows, sunroof & mirrors) and exhaust or emission control top the list for faults – very few mechanical faults. Does it fit that the more tech fitted, the more problems? Perhaps it’s this that the Which? study relates to.

Buying advice

The simple truth is that reliability has increased exponentially over the last two or three decades, and we’ve gone from adjusting the ‘points’, setting the timing, mopping up oil and having regular ‘tune-ups’ to barely lifting the bonnet between services, and perhaps that’s only to top-up the screenwash.

Instances of mechanical failures are on the decline; robots build cars, components are checked automatically, anything outside of tolerance is re-purposed – there really isn’t such a thing as a ‘Friday afternoon car’ anymore, but we expect so much more, but part of that is because we know so much more.

The world of internet has opened up a new knowledge-base, as has the car’s ability to tell us something is wrong, but it’s entirely due to the technology fitted that the majority of reliability concerns arise, but that in itself is a benefit.

According to the Which? survey, the worst offending cars are off the road for an average of 2.58 days in a year, if they were treating mechanical breakdowns, you could easily double that, with an appropriate increase in labour to strip & rebuild, rather than reprogram.

Perhaps the better headline should be “Cars are so reliable today that even the worst offender only spends two-and-a-half days off the road”.

The term ‘reliability’ is relative, the defining key to it is quite fluid – a problem with the satnav, for example, doesn’t render the car unusable or unsafe, merely … not what we expect in this day and age, and surely that in itself speaks volumes?

Yes, it’s technology that’s causing the majority of these ‘reliability’ problems, but equally, it’s technology that has solved the wider issue of mechanical breakdowns – leaving us stuck by the side of the road waiting for a recovery vehicle.

If you are looking for a new car, and want something a bit smaller, then look no further than the Volkswagen Polo 1.0 TSI 95 SE which one the Small Car of the Year award at the WhatCar? awards this year. Our partner CarKeys can help to source this car for you, simply head here, and fill in your details and they’ll be in contact.

What do you think of the Which? survey? Have they got it right, or is it misleading the buying public? Let us know in the comments.

Electric cars can have 40% less range in freezing temperatures

The writing has been on the wall for a while now: Electric cars are here to stay, the death knell is ringing for fossil fuel.

That’s all very black & white though, and the reality is perhaps a little different. Certainly, electricity is the motive force of the future, and for the moment, developments are happening so fast that even oil giants like BP are investing heavily in the infrastructure. But can BEVs really cope with everything that internal combustion can?

At the moment, not really.

That isn’t to say that they aren’t a viable alternative right now, just that any owner of a Battery Electric Vehicle needs to get used to that twinge in the pit of their stomach called ‘Range Anxiety’.

Range anxiety

Read any write-up, report or owner’s perspective about their BEV and they all mention the same thing – fantastic in every way aside from the range anxiety, which they’ve all suffered from at some point.
Typically, ‘optimum’ ranges can be anywhere between 130 miles – 290 miles depending on the vehicle, but just as manufacturers use their know-how to ‘increase’ the mpg figures for a regular car, so do electric vehicle manufacturers.

One example of this is temperature. Although each manufacturer does carry out extreme weather testing, the published figures are, of course, taken from optimum conditions – battery cells like to be comfortable, around 21 degrees Celsius, start deviating from that temperature, and things start looking different.

The American Automobile Association have recently compared the effect that temperature can have on the optimum range, and staggeringly, it could be as much as 41% to the deficit in cold weather. That doesn’t mean the reverse is true either; warm things up above the optimum, and you’ll still see a decrease in battery reserve, although not as acute.

For the record, we aren’t talking extremes of weather unlikely to be found in the UK – approximately 6 degrees below zero, or 35 degrees above.

Extreme weather effects

The decrease in range is down to a number of elements, partly physics, partly comfort.

Timothy Grewe, chief engineer at the General Motors Electric Propulsion Laboratory explains: “When the weather gets cold, the battery components develop increased resistance that limits how much power they can hold, as well as how fast a battery pack can be charged or discharged”.

That loss of efficiency equates to around 12% without the heater running, but staying warm could add a further 28% loss in range; testers noticed an overall loss of 41% on some models, including the heating system for the battery (which is separate from the cabin heater).

While extreme warmth also loses range, it’s nothing like as much – around 4% without the air-conditioning running, and 17% with.

While few manufacturers have officially commented on AAA’s findings, a spokesperson for Tesla commented: “Based on the real-world data from our own fleet, which includes millions of long trips taken by real Model S customers, we know with certainty that even when using heating and air-conditioning, the average Model S customer doesn’t experience anywhere near that decrease in range at -6 degrees, and the decrease in range at 35 degrees is roughly 1%”.

<!-- /283405443/PTP_Video_640x442 --><!-- [et_pb_line_break_holder] --><div id='div-gpt-ad-1549281272220-0' style='height:442px; width:650px;'><!-- [et_pb_line_break_holder] --><script><!-- [et_pb_line_break_holder] -->googletag.cmd.push(function() { googletag.display('div-gpt-ad-1549281272220-0'); });<!-- [et_pb_line_break_holder] --></script><!-- [et_pb_line_break_holder] --></div><!-- [et_pb_line_break_holder] -->

Battery improvements

While we’re used to seeing improvements in the technology, batteries and range, these losses may be difficult to engineer out. An internal combustion engined car has lots of spare heat energy, so diverting some of that to the cabin is relatively straightforward, but an electric car only has the capacity to generate heat by using the onboard electricity.

It’s a similar story for the battery heating system.

It would seem as though the best advice if you have an electric vehicle is to try and pre-condition the car while it’s still plugged in – either heating it up or cooling it down, most of the BEVs allow for this, along with storing it in the garage or at least ‘out of the wind’ where possible.

Future-proof

There is no doubt that electric vehicles are taking big steps toward being a genuine, viable alternative to their internal combustion counterparts, but that’s at a price, both in terms of financial and practicality. There are still a number of issues that need ironing out before they truly beat fossil-fuel in a fair fight, but is that so surprising seeing that the car as we know it has been under development for well over a century?

No doubt that someone will point out that electric vehicles were also developed over 100-years ago, but they were never mainstream, or that both petrol & diesel also lose efficiency when temperatures plummet, but the difference here is that it’s an easy job to refuel, that takes 5 minutes.

Would you own an electric vehicle? Is it something that you want, but practicality or financial reasons outweigh the decision? Let us know in the comments.

Half a million drivers seen using mobile phone at wheel in 2017

Using a mobile phone at the wheel is never a good idea, and except in some extreme circumstances is also illegal. Between 2013 and 2015 an average of 24 people were annually killed in a car crash where a mobile phone was cited as the main cause.

While the number of people using a phone at the wheel has fallen since 2015, experts are worried that the statistic doesn’t reflect the actual number of those using phones.

Roadside survey

The phone observations were done through a roadside survey conducted over a period of time by the Department for Transport. The survey is done every two years, and there was a 0.5% decrease in mobile phone use noted from the 2015 survey to the 2017 survey.

Observations were made while cars were stationary and when they were moving, in order to properly understand the difference in behaviours.

Over 90 different sites were used in the survey, in different areas and spread far across the country. Some were rural, some suburban, and some were urban. Motorways were not included in the survey as it is impossible to get accurate results from such high-speed roads.

Unpacking the stats

The survey found out loads of statistics about user behaviour, but what does it actually show us about how people use mobile phones, and what tech companies should be doing to help stop the 24 people a year who die because of a driver using their phone.

Overall, 1.1% of drivers were observed using a mobile phone on a weekday. Interestingly, the difference between Scotland and England and Wales was over double, as drivers seen on their phone was 2%, compared to 0.6% in England and Wales.

Motorists between ages 17-29 were the worst offenders with 4% of drivers in that age category caught using a phone at the wheel. However, the gender split for all age groups was fairly minimal with 1.2% of men and 1.1% of women getting caught.

The introduction of the stricter law in March 2017 will have impacted the results, but the DFT clearly states that “this does not imply causation or prove the effectiveness of the policy.”

<!-- /283405443/PTP_Video_640x442 --><!-- [et_pb_line_break_holder] --><div id='div-gpt-ad-1549281272220-0' style='height:442px; width:650px;'><!-- [et_pb_line_break_holder] --><script><!-- [et_pb_line_break_holder] -->googletag.cmd.push(function() { googletag.display('div-gpt-ad-1549281272220-0'); });<!-- [et_pb_line_break_holder] --></script><!-- [et_pb_line_break_holder] --></div><!-- [et_pb_line_break_holder] -->

Real life impact

Using a phone behind the wheel is a choice, and those who do are not only putting themselves at risk, but also everyone around them. The sad death of Carol Boardman in 2016 after a motorbike hit her, was cited due to the rider being distracted by his mobile phone. Similarly, the case of David Shields up in Scotland shows the same. He was playing for his mobile phone for a total of 18 seconds before he crashed into the back of Yvonne Blackman’s car, of which she later died of severe injuries sustained from the crash.

Distracted driving is becoming a real issue, and now with cars implementing more and more tech, are we on the brink of an increase in distracted driving collisions?

Cars are also getting safer and safer, so are we taking our driving less seriously as we know our cars can protect us? Even 20 years ago, cars were a lot less safe, and people were aware and so drove more carefully. Now, our cars protect us more and more, they have special protective elements, from crumple zones to pre-collision sensors and automatic emergency braking.

What needs to change?

Experts are concerned that the reality of these stats isn’t true and that the actual figures are much higher.

Tech companies are working on ways to help stop users behind the wheel, and Apple has their “Do Not Disturb While Driving” mode for iOS 11 and up that automatically detects when you are driving and will switch it on. It replies to all texts with an automatic response and keeps the screen off and silent. If you have Bluetooth or a phone interface in the car, it will allow the phone to connect to that, but keeps it silent still.

Android, unless you have a Google Pixel 2 or up, doesn’t automatically have this feature, although the phone does know when you are driving through Google Maps. It is thought that they are rolling out this feature to more phones soon.

There’s a couple of apps you can get for Android that work quite well, depending on your preference. If you want a handsfree experience then you can use Android Auto, which while a bit clunky and slow works very well as a simple interface. It will allow you to automatically reply to texts and can auto-reply to calls with an “I’m driving right now” if you’d like it to. Auto also has your music, maps and calls in a large menu at the bottom of the screen.

If you’d prefer a complete Do Not Disturb experience, then there are plenty of apps out there that offer such a thing, while it’s not compatible with all Android devices, an app called Driving Detective mimics the Apple features for Android.

What do you think of the statistics? Should the law on mobile phones become stricter? Let us know below