Oct 18, 2017
If you go on a long car journey, a service station is likely to feature as part of the trip – whether it’s to use the toilet, stop for a coffee or grab a bite to eat. There’s nothing glamorous or luxurious about the service stations around the UK. However, some are certainly better than others. So, what makes a good service station? And which are the best and worst of the bunch around the UK?
Customer survey
Transport Focus, the travel watchdog, recently conducted a survey of some 8,700 customers. It looked at key areas around their visits to service stations, including the food, staffing and those all-important toilet facilities. The results revealed that some of the service stations were rather impressive, while others left a lot to be desired.
Based on the survey’s results, the top five service stations in the UK are:
• Reading Westbound M4 (Berkshire)
• Rivington Northbound M61 (Bolton, Lancashire)
• Corley Northbound M6 (Warwickshire)
• Gloucester Southbound M5 (Gloucestershire)
• Gloucester Northbound M5 (Gloucestershire)
At the other end of the scale, the worst five stations are:
• Heston Eastbound M4 (Middlesex)
• Stafford Southbound M6 (Staffordshire)
• Rownhams Southbound M27 (Hampshire)
• Rownhams Northbound M27 (Hampshire)
• Toddington Southbound M1 (Bedfordshire)
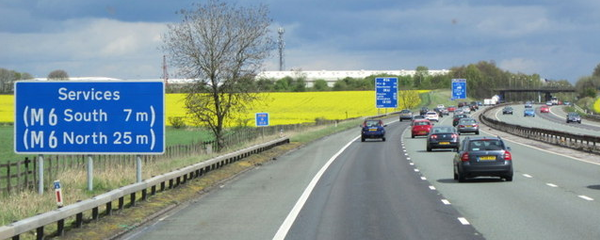
(Credit – Ian S)
What makes best and worst
Heston was rated as the worst in the country. The company that runs it, Moto, pointed out that the survey was done while there were building works going on. That may explain why some people complained about the “very smelly toilets.” Heston is also one of the smallest service stations in the entire Moto network and could therefore not provide many of the facilities of larger sites.
At the top of the chart, Reading scored an impressive 100% on its satisfaction survey, ironically also operated by Moto. According to the Transport Minister, John Hayes, service stations should be places for drivers to enjoy, rather than endure. This certainly seems to be the case with Reading’s westbound M4 offering, which was praised by reviewers for cleanliness, friendliness of staff and value for money.
Aiming for high standards
The survey asked drivers what they look for in a service station. Obviously, the basics are at the heart of the service – cleanliness, a range of relevant services and facilities and a decent selection of food options. Many service stations now have a number of food outlets under one roof, ranging from coffee shops to fast food joints. Many also offer a supermarket presence, such as Marks & Spencer or Waitrose, for drivers to stock up on essentials for the rest of the journey, conference facilities or hotels. One site (Beaconsfield on the M40) even offers a pub as part of its motorway service station. There’s also a trend towards drive through coffee shops in some locations.
Gloucester is one location that ranks in the top five (twice). It sets an example of the way forward for service stations. Instead of the typical fast food outlets, this service station is home to a café and a farm shop. In fact, the food there is so good that it received a nomination for the Best Food Retailer from the BBC Food and Farming Awards. It sources most of its foods from within 30 miles of the station and even provides an on-site butcher.
Sometimes it’s the additional features that make the difference for drivers. A lake to sit beside while eating your McDonald’s is one example, while a safe playground for the kids to let off some steam is another popular option.
Increasingly, service stations are offering more than just a place to have a burger and a toilet break. No doubt service stations up and down the country will now be considering how they can improve their performance before next year’s rankings.
Have you had a particularly good (or particularly bad) experience at a service station? We would love to hear about it – leave a comment below to share your experiences!
Oct 11, 2017
The Department for Transport has released its annual report on the number of accidents and deaths on the UK’s roads. The number of people killed has gradually declined over the last ten years. However, the number of deaths on our roads between 2015 and 2016 has suddenly increased by 4%. Are our roads becoming more dangerous?
Road deaths rise by 4%
According to the report, 1,792 people were killed in accidents during 2016. That’s, an increase of 4% on the previous year (though still a 6% decrease on 2011’s figures). In addition, 24,101 people were seriously injured, an increase of 9% on the previous year and 4% on 2011.
Thankfully, there was at least some good news, in that the number of people slightly injured decreased by 4% year on year, to 155,491. That figure is 13% lower than the number of those slightly injured in 2011.
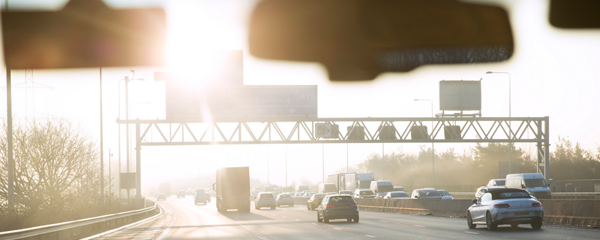
Annual Report – number of accidents and deaths on UK roads
Overall, the figures showed an increase of 62 fatalities on the roads in 2016 when compared with 2015. However, the authors noted that some police forces have changed how they record statistics. This could perhaps account for some of the changes in the statistics.
(Credit – Highways England CC by 2.0)
What affects the figures?
The report states that there is no single underlying factor that leads to road casualties. Instead, there are a number of influences. These include:
- The distance that people travel – this can be affected by economic factors, such as having to travel further to work or to go shopping
- The blend of transport modes in use
- The behaviour of drivers – along with that of riders and pedestrians
- The mixture of people using the roads – the balance of older drivers and younger drivers, for example
- External factors – the weather, for example, can change the number of driving people and also the road conditions, with rain making the road slippery and encouraging people to use their cars rather than walking
Road user type
Another element examined in the report is the type of road user. The data looked at how many road users of each type were included in the casualty figures.
In 2016, there were 816 fatalities in cars. These accounted for 46% of the total figure – an increase of 8% over the previous year. Meanwhile, 25% (448) of people killed were pedestrians, a 10% increase on 2015. The number of people on motorcycles decreased by 13%, to 319, while 102 cyclists were killed – an increase of 2% on last year. The remainder of the number were counted as ‘other’ and had increased by 4%.
Dealing with an accident
Car users are the most likely group to be involved in an accident. This is hardly surprising, given that they make up the majority of road users. Motoring organisations have long issued guidance on how to try and avoid accidents. Now, they’re adding in advice about what to do if you are involved in one.
A long-standing idea has been not to apologise, as this amounts to admitting fault legally. While this is generally the case, it doesn’t mean you shouldn’t offer help, make sure everyone is okay and wait for the authorities to arrive, if they are coming.
Likewise, for pedestrians, there is clear advice available to try and reduce the risk of becoming a statistic. This includes steps such as using pedestrian crossings wherever possible and to ensuring you’re visible to motorists so they can avoid you. Also, don’t be tempted to read that text message while walking – you could walk into the road and cause an accident due to a lack of concentration. Wait until you’ve reached your destination instead. The same goes for drivers, of course.
Do you feel any less safe on our roads of late? Are we becoming increasingly distracted by technology as we drive or could another factor be behind the rising number of road deaths? Leave a comment to share your thoughts.
Oct 11, 2017
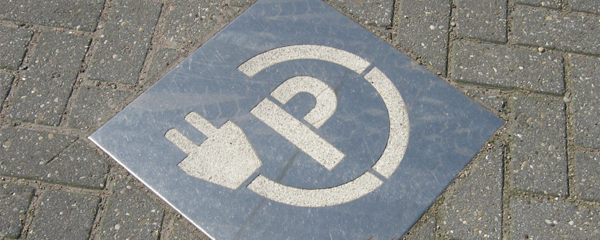
The government is laying out the adoption of electric vehicles (EVs) as the path for us to follow, as it sets about fulfilling its pledge to ban petrol and diesel car sales by 2040. However, there are obstacles in the way that prevent people from considering the switch. One of the biggest appears to be the lack of a public charging network. High insurance costs are also proving to be a barrier for many.
Plugging in
According to a report by the RAC Foundation, 80% of EV owners have access to charging stations at their own homes. In addition, 93% of them use the public charging network. Concerns are now growing that, as the number of electric vehicles rises, this network is going to prove a big problem. For example, in June this year, 13% of charging points were out of action. The lack of standardisation of connectors and charging protocols could also result in problems for some EV users.
Another problem is that rapid charging points – at 50KW and above – are crucial for drivers using their electric vehicles for long journeys. However, these same points are useless for plug-in hybrid vehicles if they can only charge at 3.6KW.
Quantity not quality
The RAC Foundation report highlights that part of the problem is the Department for Transport’s commitment to quantity rather than quality when it comes to EV charging points. This has resulted in a network that is “unattractive to use and unsuitable for the next wave of EV customers.”
As more and more companies announce they are working on electric vehicles (Dyson is the latest to throw its hat into the ring), the government needs to put far more effort into improving the infrastructure for these vehicles. This is essential if it wants to have any chance of fulfilling its pledge to ban petrol and diesel cars by 2040.
Easy access
Currently, filling up your car with petrol or diesel is something that we hardly need to think about. There are frequent garages with the facilities that we need. This needs to be replicated with the public charging network. Garages nee to offer the right charging stations in the right locations – along with the right tariffs. If drivers are to be persuaded to switch to EVs, they need adequate, widespread and reliable refuelling locations – not the prospect of queues every time they are lucky enough to find somewhere to charge up.
Insurance adds to EV woes
According to Compare the Market, the lack of EV infrastructure isn’t the only problem facing people who want to switch from petrol or diesel vehicles to more environmentally friendly models. New data shows that they will also face considerably higher insurance premiums for their new electric vehicles.
According to quotes on the comparison site, the average premium for an electric vehicle stands at £1,070. That’s a whopping 45% more than for the average petrol or diesel vehicle, which comes in at £740. The reason given for this is that the repair of electric vehicles is more expensive, especially if the battery is damaged in an accident.
What is most worrying is that the government – and, indeed the car industry – seems to have thrown all its weight behind electric vehicles as the way forward. There is a huge lack of other options. Despite this, public uptake remains slow. Of the two million new cars sold this year, just 4.6% of them have been alternative fuel cars. There’s still a very long way to go when it comes to winning the public over to the idea of electric vehicles.
What’s stopping you from embracing electric vehicles? Is it the high insurance cost or issues relating to charging? Let us know by leaving a comment.
Oct 11, 2017
The cost of Unleaded fuel has fallen in the past two weeks by 0.8 pence a litre due to a fall in the cost of wholesale fuel, as reported widely in the media, but the same can’t be said for diesel. According to the latest information on PetrolPrices, in October average diesel prices have increased by 0.3 pence per litre, giving diesel drivers yet another reason to be concerned about their choice of car.
Supermarket price cuts
PetrolPrices reported two weeks ago, ASDA claimed to had dropped their prices by 2p a litre, but our research at that time found that prices were still rising at that point.
Since then ASDA, Morrisons and Sainsburys have all finally started to cut the cost of unleaded on their forecourts. ASDA as usual, took the first step by reducing the cost of unleaded by up to 2 pence per litre across its 308 petrol stations. This dropped the price considerably lower than the average throughout September. Morrisons reacted quickly to ASDA’s change as the cost of wholesale fuel reduced. The chain’s willingness to pass savings on to its customers has pleased motoring groups.
Driver benefits
The leading supermarkets’ quick reaction to lower wholesale prices has left not just motoring groups happy, but consumers too. Motorists tend to spend more on fuel as the Winter months close in. Cold cars need to use more fuel in order to run and power heating systems. As such, this price drop will be a real help to those who drive Unleaded cars, but the same cannot be said for Diesel drivers, where a small price rise feels like another kick in the teeth.
Unleaded fuel rose to an average of 119.3 pence per litre before this recent drop, which has now fallen to 108.5 pence per litre. This was due in part to tropical storm Harvey disrupting oil refineries in Texas, which pushed up the wholesale price. With Harvey bringing winds strong enough to shut down plants on the Gulf Coast, this caused a surge in the demand for unleaded which threatened to become more expensive than diesel.
Diesel drivers out of luck
As the price of a barrel of oil has risen to $69, its highest rate since summer 2015, diesel drivers unfortunately cannot expect similar price reductions at the pump. In fact so far in October, average diesel prices have increased by 0.3 pence per litre.
The situation deals a fresh blow to diesel drivers, who have already had a run of bad news following the government’s change of heart about diesel cars, as well as the introduction of an emissions charge for those who drive in the capital.
Despite diesel cars being championed as being better for the environment by past governments, it has now been found that even new diesel engines are far more polluting than first thought. A typical diesel car emits 3.65 more tonnes of carbon dioxide over its lifecycle than a petrol car does.
This is thought to be because diesel has to undergo a more intensive refinery process. It combusts at a higher temperature than petrol, so its components weigh more. It is because of this that governments across Europe have been making plans to ban diesel cars, along with older petrol models, from their roads over the coming years. This is all part of a bid to clean up the air in their major cities, with London being a prime example.
New diesel sales figures dive
Although this doesn’t seem to be putting people off of buying second-hand diesel cars, the demand for new diesel cars has taken a big hit. The number of new registrations in September was down by 21.7% year-on-year. This suggests that people are confused about the air quality plans and aren’t confident about purchasing a new diesel until they know more.
With all of these talks around diesel cars focusing on the negatives, and giving this particular fuel type increasingly bad press, diesel drivers are going to feel even more targeted because of their car choice if they start consistently missing out on lower prices at the pumps too.
Are diesel drivers more likely to change their vehicle type if they’re feeling the pressure at the pumps? Will this be the final straw for already beleaguered diesel drivers? Share your views by leaving a comment.
Oct 5, 2017
Car theft has risen by 30% in recent years, with 85,688 cars reported as stolen in 2016. That compares to just 65,783 in 2013. The figures, gathered by the RAC from 40 police forces using a Freedom of Information request, raise questions around the efficacy of modern anti-theft technology. The RAC also found a notable rise in the theft of motorcycles and scooters.
The numbers from Warwickshire were the most shocking. Car thefts there rose by 189% between 2013 and 2016. Hampshire was second, with a 59% rise, followed by West Yorkshire, with an increase of 57%. In fourth place was Norfolk, with a 56% rise in car theft over the period.
Is modern technology failing?
This rise in car theft is surprising, given the amount that car manufacturers have been spending on fitting new cars with what they believe are effective alarms and immobilisers. The reality seems to be that ‘high-tech car thieves’ are able to get around these without too much trouble at all.
Cars that use keyless fobs seem to be the worst hit, according to the RAC’s research. The findings suggest that this particular technology is far from secure. It seems that those who know how can manipulate the devices to facilitate their criminal plans.
Organised gangs are now one of the main issues when it comes to car theft. They steal cars and export them abroad for profit. One gang was even seen stealing a £60,000 BMW X5 by holding a bag up to a house door. The method suggests that they used a device to activate and extend the reach of the keyless fob inside the home.
The police, Home Office, National Crime Agency, National Vehicle Crime Intelligence Service, Europol and car manufacturers are working together to try and crack down on car crime. However, it seems that the anti-theft devices being put in place are just not up to scratch.
Car theft rates had actually been decreasing since 2002. This highlights the fact that it is the latest technology that is making it easier for people to steal vehicles.
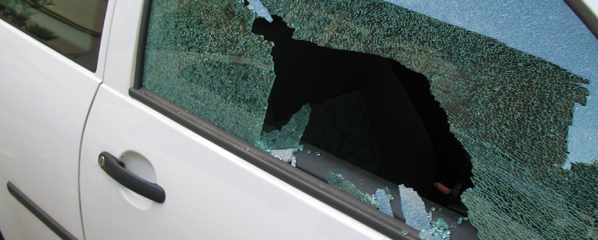
(Credit – Turelio CC by 3.0)
How to keep your car safe
In addition to the fear of having their cars broken into, motorists are also seeing this rise in car thefts have an effect on insurance premiums. Combined with a variety of other factors, this is making the cost of driving even more expensive.
One consequence is a rise in the number of people purchasing anti-theft devices like those used back in the 1980s and 1990s. Steering wheel locks and gear stick locks are enjoying something of a resurgence.
There are several steps you can take to help keep your car safe. Firstly, parking it somewhere safe particularly at night. Always remember to lock it, with all windows and the sunroof closed securely. Remember to leave all valuables out of sight as well. You should also ensure that you have any appropriate alarms and immobilisers fitted, which will hopefully deter anyone who is hoping to steal it.
In addition to this, never leave your car running while it is unattended. Also try to avoid leaving your registration document in the vehicle, as this can help thieves to get away with stealing it if they’re stopped by the police.
If you want an obvious deterrent, a steering wheel lock is ideal. This shows people that you’ve taken steps to secure your car, which may make them think that you have other devices in place too (even if you don’t).
By following these tips, you can decrease your chance of being a victim of car theft, even if the numbers continue their steep rise.
Have you noticed your insurance premiums rising in line with the increase in car theft? Have you resorted to purchasing physical security devices to complement technological ones? Leave a comment below to share your experiences.
Oct 5, 2017
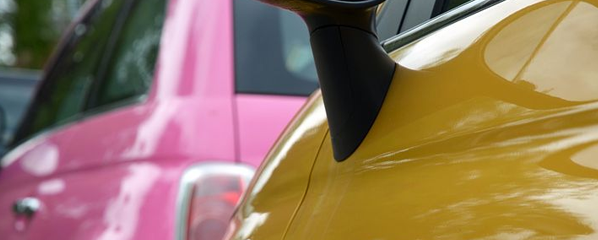
There are lots of factors to consider when choosing which car to buy – brand, model, which colour you prefer and which colours are available in the spec you want, to name but a few. However, few people consider the likelihood of being clamped when choosing their vehicle. Now, new data from the DVLA shows which cars are the most likely to be clamped – and silver Porsches seem to be top of some clampers’ hit lists!
Choose your colour carefully
The new figures show that silver cars are more likely to be clamped around the UK than any other colour. According to the DVLA’s report on clamping figures for 2016, some 118,000 vehicles were clamped or impounded during the year due to not having valid tax. Of those, silver vehicles accounted for 30,035 of the total. Next came blue vehicles, at 23,411, followed by black vehicles at 21,270.
At the other end of the scale were gold, beige and yellow vehicles, with the lowest number of incidences of being clamped. However, could this be more to do with the popularity of the colours themselves, rather than the driver’s habit of getting into trouble?
UK drivers are rather a boring lot when it comes to car colour choices. According to the Society of Motor Manufacturers and Traders, the most popular choice of vehicle colour in the UK in 2016 was white, which accounted for 20.51% of newly registered cars. This was followed by black in second place and grey in third.
The top primary colour is blue, which came in at fourth place with 15.38% of new registrations, an increase of 7.2% on the previous year – showing that colour fans are beginning to show their face in the car-buying world. Red came fifth, followed by silver, green and orange. The biggest decrease in popularity is the brown car, which has seen a 40% decrease in the number of requests in the last year.
It is interesting that silver cars are only the sixth most popular choice of colour, yet the most clamped for non-payment of tax. Could it be that those who are inclined to dodge their vehicle tax obligations have a penchant for silver? Or are silver car drivers just more forgetful than most?
Car makes and clamping
While silver may be the sixth most popular colour, and the most likely to be clamped, what about the type of car?
According to the DVLA, the make and models of cars most often clamped largely reflect the most popular makes and models of cars on the road. The Ford Focus and Vauxhall Astra were top of the list in 2016, with more than 5,000 of each being either impounded or clamped.
But it isn’t just everyday vehicles that feature on the list of clamped vehicles. The 2016 figures showed that the most commonly clamped prestige car is the Porsche. 137 Porches were clamped for not having valid tax in 2016 – more than ten times the number of the second most clamped luxury vehicle (the Bentley, just 12 of which were clamped during the year).
There are also some unusual vehicles on the list. In 2016 the UK authorities clamped or impounded 68 London taxis, two Gulf Stream motorhomes, three Reliant Robins and even a tractor.
When can you be clamped?
Clamping has been a controversial subject in recent years. New guidelines have been brought in to reduce the number of ‘dodgy’ clampers out there. In most cases, for example, you can’t be clamped on private land. However, the police can remove a vehicle that is blocking a road, even if it has broken down.
The Vehicle Operator Services Agency (VOSA) can also clamp a vehicle if it is a danger to road users or if there are outstanding fines on the vehicle. And, of course, your vehicle can be clamped if you don’t have road tax on it, so if you’re in any doubt at all, double check now that you’ve paid your tax. Particularly if you drive a silver Porsche.
Why do you think that silver car drivers are clamped so much more often than those of other colours? Is clamping the right way to tackle non-payment of tax? Share your views by leaving a comment.
Oct 5, 2017
Do you enjoy driving round looking for a parking space? Whether you’re out shopping or trying to park outside your own house, there’s little more irritating than having to hunt for a parking space day after day. Now, new data has shown that it’s not a lack of parking spaces that’s the issue. People are in fact parking so badly that
a fifth of all kerbside parking spaces are going to waste. Direct Line Car Insurance commissioned a review of 120 roads that were often described as being “full,” to find out why people were finding it so difficult to park on them. The study uncovered that 17% more parking space would be available on average if people parked more effectively. That would be enough to accommodate thousands of vehicles. If everyone used parking assist technology, which helps find spaces that are the right size for your car, and ensures that you use the space correctly, this would go a long way towards freeing up the lost 17% of parking space.
The UK’s worst cities for parking
London and Birmingham were found to have the most parking space wastage, at 20% each. The study found that drivers in these cities left the greatest distance between their cars. Conversely, Brighton was found to have the most efficient parkers, with just 11% of space left unused on “full” streets. Out of 2,000 drivers who were questioned as part of the research, 47% said that poor parking has caused them major frustration over the past year. Furthermore, 40% avoid going to the shops because they’re concerned about parking. This is bad news for the UK’s businesses. When it comes to bad parking habits, 13% of drivers admitted to parking across two spaces in order to save a space for someone else. Meanwhile, 11% said they had put a bin in a parking space to secure it, while 38% had deliberately left space to protect their car. A guilty 10% of motorists had parked in a space so small that others couldn’t move. By contrast, a whopping 73% had left space so that they could easily manoeuvre. The study also found that 31% of motorists had chosen a space based on the quality of the cars parked on either side of it. 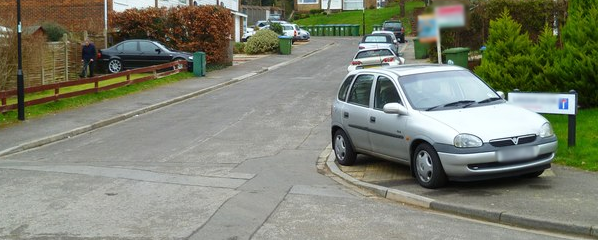
(Shazz by CC 2.0)
Parking with confidence
Looking at people’s parking confidence also uncovered a few surprising details. A fifth of people had parked away from home to avoid parking in a difficult space. Around the same number had asked a friend or relative to park for them. In addition to this, 18% of drivers had given up on trying to park in a space because someone was watching them. Inrix has calculated that Brits spend an average of 44 hours per year looking for parking spaces. That adds up to £733 per driver in wasted fuel, time, and emissions. The situation is even worse in London, where people spend as many as 67 hours per year trying to park, at a cost of £1,104. Belfast, Leeds and Bristol also score highly when it comes to time spent searching for a parking spot. On a UK-wide basis, it has been suggested that a total of £30 billion is wasted on this time-consuming exercise every year.
The worst parking in the UK?
One of the worst cases of parking that was reported on earlier in the year was that of a driver who had parked their Seat over four parking spaces. The motorist was concerned about another driver hitting their vehicle. The selfishness involved caused uproar. By parking inefficiently, drivers are wasting valuable space that could be used by other motorists. Bad parking habits mean that people are spending an unreasonable amount of time and money searching for somewhere to park. With this in mind, it may be that parking assist technology should be on everyone’s car wish-list in the future. This could make parking a more efficient and less stressful task for drivers up and down the UK. Do you ever park across two spaces in order to protect your car? Is doing so common sense or pure selfishness? Leave a comment to share your views.
Oct 5, 2017
A review of fuel prices for September shows that the overall cost of filling up at the pump has increased again, for the second month in a row. The average price of unleaded hit 119.3 pence per litre in September, up by 2.7 pence from August’s prices. Meanwhile, diesel drivers saw a month-on-month increase of 2.6 pence per litre, taking the average September price to 120.0 pence. The increases mean that diesel is now at its highest level since April, which unleaded has not been this expensive since February.
Part of the reason is the cost of oil, which is at its highest price per barrel since July 2015. This has led to widespread increases in prices at the pumps, as manufacturers quickly reflect their increasing wholesale costs. As ever though, the regional picture around the UK varies greatly when it comes to fuel price.
The most expensive place to buy fuel
Diesel
For diesel drivers, the most expensive location to buy fuel was once again Tighnbruaich in Argyll & Bute. Prices there were a whopping 15.9 pence per litre above the national average. This was followed by Acharacle in Highland in second place, while in third place for September was Markfield in Leicestershire.
| Price |
Location |
County |
| 135.9 |
Tighnbruaich |
Argyll & Bute |
| 134.8 |
Acharacle |
Highland |
| 132.0 |
Markfield |
Leicestershire |
| 131.9 |
Freshwater |
Isle of Wight |
| 129.9 |
Isle of Benbecula |
Eilean Siar |
| 129.9 |
Woolacombe |
Devon |
| 128.8 |
Seascale |
Cumbria |
| 128.8 |
Gretna |
Dumfries & Galloway |
| 127.9 |
Cowes |
Isle of Wight |
| 127.8 |
Lockerbie |
Dumfries & Galloway |
Unleaded
As well as being the second most expensive for diesel, Acharacle was also the most expensive place in the UK to buy unleaded during September. From the list below, you can see that Scottish locations feature heavily in the list of most expensive locations, taking the top three spots. That’s in spite of Aberdeen’s position at the centre of North Sea offshore oil and gas industry. It’s worrying to consider what will happen to fuel prices over the longer term, as the UK enters its “final decade of production.”
| Price |
Location |
County |
| 134.5 |
Acharacle |
Highland |
| 132.9 |
Tighnbruaich |
Argyll & Bute |
| 131.1 |
Gretna |
Dumfries & Galloway |
| 129.9 |
Freshwater |
Isle of Wight |
| 129.4 |
Markfield |
Leicestershire |
| 129.1 |
Lockerbie |
Dumfries & Galloway |
| 128.9 |
Isle of Benbecula |
Eilean Siar |
| 128.9 |
Woolacombe |
Devon |
| 127.3 |
Lymm |
Warrington |
| 127.1 |
Isle of Arran |
North Ayrshire |

The cheapest place to buy fuel
Diesel
The cheapest place to buy diesel in September was Leigh in Greater Manchester, followed by Currie in the City of Edinburgh. Drivers around Manchester are experiencing a good spell on the cost of their fuel, with Dukinfield in third place on the list. August’s third place, Spennymoor in County Durham, fell to fifth this month, as drivers saw an increase in their local fuel costs.
| Price |
Location |
County |
| 114.6 |
Leigh |
Greater Manchester |
| 114.7 |
Currie |
Edinburgh, City of |
| 114.7 |
Dukinfield |
Greater Manchester |
| 114.7 |
Tamworth |
Staffordshire |
| 115.4 |
Spennymoor |
County Durham |
| 115.4 |
Loanhead |
Midlothian |
| 115.4 |
Havant |
Hampshire |
| 115.7 |
Cromer |
Norfolk |
| 116.1 |
Penzance |
Cornwall |
| 116.4 |
Tilbury |
Thurrock |
Unleaded
Leigh in Greater Manchester also topped the list for the cheapest unleaded price, giving drivers there double cause for celebration. Prices were well below the national average of 119.3 pence per litre, meaning a saving of 6.2 pence on every litre for drivers who filled up in Leigh. Currie was in second place for unleaded prices, as well as for diesel, while Penzance in Cornwall took third place. August’s cheapest unleaded price location, Dukinfield in Greater Manchester, fell to fourth place in September.
| Price |
Location |
County |
| 113.1 |
Leigh |
Greater Manchester |
| 113.5 |
Currie |
Edinburgh, City of |
| 113.6 |
Penzance |
Cornwall |
| 113.9 |
Dukinfield |
Greater Manchester |
| 114.1 |
Tamworth |
Staffordshire |
| 114.6 |
Cwmbran |
Torfaen |
| 114.7 |
Limavady |
County Londonderry |
| 114.9 |
Sandown |
Isle of Wight |
| 114.9 |
Spennymoor |
County Durham |
| 115.0 |
Loanhead |
Midlothian |
Good news ahead?
Industry experts believe there is good news ahead for the UK’s motorists, despite the near 10% rise in oil prices. A 4% rise in the value of the pound is offsetting some of the fuel price rises experienced in September. Furthermore, the RAC has projected a drop in wholesale prices over the coming weeks, which could be reflected by a drop of as much as 2 pence per litre in fuel prices. We live in hope!
Have you noticed the increase in fuel costs over the past month? Does pricier fuel mean you use your car less? Leave a comment to let us know.
Sep 27, 2017
Historically, older drivers have enjoyed lower car insurance premiums than other age groups and been less hard hit by market increases. However, since May, insurance premiums have risen at five times the rate of inflation and older drivers are the ones seeing the highest percentage increase.
Is this unfair opportunism by insurers taking advantage of a group with previously lower prices? Or is the increase justified for older drivers – are they simply more of a danger on our roads?
The insurance market
According to the latest figures, premiums have increased by an average of 14.6% in the last 12 months to reach an average figure of £755. This is a rate that is five times the inflation rate of 2.9%. The rises mean that younger drivers now pay an average premium of £1,719.
Insurers have blamed a number of factors for the shocking rises including the increase in taxes, the weak pound and changes to the discount rate used to calculate claim pay-outs where personal injury is involved. This is in addition to the standard declaration of increased claim costs.
While younger drivers (and often their cash-strapped parents) are used to eye-watering premiums, older drivers are not. However, it seems that the latest rises are looking to reverse that situation, with older drivers experiencing the biggest increase, at an average rise of 16.5%. That puts the average premium for this age group at £434, according to Consumer Intelligence.
The older driver market
Many argue that older drivers have seen the steepest premium rises because they are responsible for more crashes than before, but do the figures back up this assertion?
According to the Department of Transport, in March 2016 there were 4.5 million people aged 70 or over with a license. 236 of these were over the age of 100.
As drivers age, they have a greater risk of health conditions that can affect their driving, such as poor eyesight or reduced reflex response time. However, researchers have shown that old age doesn’t necessarily equal more accidents. Older drivers are more likely to be killed or seriously injured in a road accident, but this isn’t always due to a poorer quality of driving – they are simply more vulnerable to injury than younger people.
Curiously, one area that did highlight an issue was making right-hand turns. 13% of those aged over 70 have had an accident involving a right-hand turn. That compares to just 7% of drivers under the age of 70. Simulator tests show that older drivers take longer to make this manoeuvre than younger ones.
Personal injury claim rates
One of the big problems blamed for the recent insurance price increases was the change to how the rate for personal injury claims was calculated. This went from -0.75% to 2.5% in a much-criticised move back in March, which aimed to ensure the long-term injured received the right payout.
The move was also behind earlier price rises. However, in September, the government announced it would change the rate again, slowing down the rate of price increase. It also says that the rate will be reviewed at least every three years, which Consumer Intelligence believes has helped stabilise prices.
The big picture
GPs have an obligation to let DVLA know if a driver is no longer fit to drive. Family members are also urged to report anyone they think is a risk. However, our ageing population means that the number of older drivers continues to increase. Could it be that this is the real reason for the increase in premiums for older drivers – that this age group is growing and thus the potential for greater profits is higher?
Should older drivers pay more for their car insurance? Or is this just another money-grabbing venture by insurance companies looking for a new group to target? Leave a comment below to share your opinion.
Sep 27, 2017
In a new twist in the ongoing anti-diesel saga, Greenpeace activists have shown how much they oppose diesel vehicles by storming a 23,000-tonne ship that was crossing the sea towards the UK to make a delivery of Volkswagen diesel cars. Their actions raise the question of how many more anti-diesel protests we might see, given the continuing negative publicity.
Anti-diesel activism
Travelling to the ship using boats and kayaks, the 25 activists attempted to climb the ship. Greenpeace has stated that it will not stop until Volkswagen commits to stop sending toxic cars to the UK and to stop using diesel for good.
Once on board, the volunteer activists attached themselves to the retractable loading ramps at the stern of the ship. They may have chosen September to strike due to the number of new cars being delivered with the latest registration plate.
Nor was it just the Volkswagen cargo ship that was in the activists’ sights. 41 volunteers also scaled fences at the Sheerness port in Kent, which is where the ship was heading. These individuals tried to confiscate the keys of thousands of diesel cars which were being held at the port.
They displayed banners at the port and at a nearby pier, highlighting the devastating impact that diesel vehicles have on the environment. The group hoped to highlight the environmental damage associated with diesel cars and with Volkswagen in particular.
Volkswagen has been at the top of many environmentalists’ hit list since the emissions scandal broke in 2015. The company was caught fitting software to its diesel vehicles, which manipulated emissions tests. Doing so meant that the firm was sending a multitude of toxic vehicles out into the market – with profits clearly being made at the expense of the environment.
In total, Volkswagen’s manipulation affected 11 million vehicles. 1.2 million of these were sold in the UK.
Volkswagen’s response
Following the incident, Volkswagen has revealed that there were actually more petrol than diesel cars on board the ship at the time of the protest. There were also 37 plug-in hybrids on board, which are definitely a more eco-friendly choice. In addition to this, Volkswagen stated that all of the diesel vehicles on board met with the strict Euro-6 standards that have been put in place.
It is unknown whether the actions of the Greenpeace activists has had an effect on getting deliveries to customers on time.
In another activism incident, Greenpeace also placed itself outside of the industry-leading Frankfurt Motor Show. The organisation’s installation included a Volkswagen Touareg, making another clear statement about its feelings towards this particular car manufacturer.
Protests on our streets?
It is easy to see why environmental activists would be unhappy with Volkswagen, and the use of diesel cars in general. Air pollution is now one of the most significant challenges facing London and many other large UK cities. Diesel vehicle fumes contain nitrogen dioxide and particulate matter that have adverse effects on human health. As such, getting these vehicles off the road would be a big step towards improving air quality.
However, it wasn’t long ago that people were being encouraged to buy diesel cars, as they produce less CO2 than petrol vehicles. It is only because the toxins being produced at a local level have been judged to be far worse that recommendations have now switched to suggesting people purchase alternatives to diesels.
If protests like this continue to grow and gain coverage in the media, the views from the public about diesel cars will surely become stronger too. Scrappage schemes and toxicity charges are highlighting how harmful diesel cars are. With activism incidents added into the mix, how long will it be before we see protests at the fuel pumps? Or on the forecourts of car dealerships? Only time will tell.
Would you take to the streets to protest against the damage that diesel vehicles are doing to our environment? Or are the government and car manufacturers already doing enough to address the issue? Let us know your views by leaving a comment below.